Objective
Ever since I did Data Science (DS) analytics for an AI start-up and put in charge of winning Instacart over, I wanted to dig deeper into the data I was given. I realzied as I was presenting metrics to stakeholders at Instacart, I was not 100% confident with what I was giving them. And it had to do with not really understanding where all the numbers were coming from. So I made sure that in my next data project, I would figure out more Data Engineering (DE)!
One set back was that I knew of the common platforms used in order to build data infrastructure– Fivetran, Stitch, Snowflake. They were perfect for enterprise scale and budget, but not for someone who just wanted to run something local to get a foundation for DE. Enter Meltano (Singer), PostgreSQL, dbt and Superset. They are free to use, can be run on a local machine and can be used at the Enterprise scale as well.
Data Source
Given that the data stack chosen to be built was meant to perform just like an Enterprise-level data stack, I wanted to go after data that was similar to what big companies deal with. So thought about continuous data that was dynamic and relevant. Hence, chose election data that gets updated continuously. This simulates user data that would stream into warehouses continuously/regularly scheduled workflows that would collect records of users’ fluctuating behaviors. This was similar to people’s voting choices. So there was the longitudinal aspect with the exception that the data was not in real-time.
Data collected was from MIT Election Data + Science Lab. Specifically, got historical U.S. elections results for the House of Representatives, the Senate and the Presidency.
Applications Needed:
- PostgreSQL - SQL client
- TablePlus - GUI for SQL client
- Python3 - most components in the stack depend on this
- Sublime - Scripts editor
Extraction and Load (Meltano)
Created local project folder and starting a virtual environment.
mkdir ds4fnp
cd ds4fnp
python3 -m venv .venv       # create your virtual environment
source .venv/bin/activate   # activate your virtual environment
Meltano helps extract away all the custom Python code needed when doing traditional ETL. What it does is pulls from data sources (taps) and puts data into data load destinations (targets).
Installed Meltano and created a new project by:
pip3 install meltano
meltano init ./meltano
cd ./meltano
After initiating Meltano, there were several subdirectories created along with a meltano.yml file. This is where most of the Extraction and Loading work was done along with working with Meltano’s CLI. For more information, this is Meltano’s documentation to understand how configuration files work.
Configuring Sources for Extraction
We will be using plugin called tap-spreadsheets-anywhere. It is able to pull data from CSV files and Excel spreadsheets on cloud and local storage. Ran the following command in meltano CLI to add extractor to my meltano project:
meltano add extractor tap-spreadsheets-anywhere
When this was completed, config section was added to meltano.yml. Then added manually into the file nested items under tables. URL’s were added to 3 different datasets from the MIT site:
- https://dataverse.harvard.edu/api/access/datafile/4202836
- https://dataverse.harvard.edu/api/access/datafile/4300300
- https://dataverse.harvard.edu/api/access/datafile/4299753
Configuring Targets for Loading
Singer target/destination was specified for CSV files to be loaded into PostgreSQL database.
PostgreSQL database and persmissions created using psql (CLI):
#via initial user login as 'postgres' with pw 'postgres' using command: sudo -u postgres psql

create database ds4fnp;
\connect ds4fnp;
create role ds4fnp with login password 'ds4fnp';
grant all privileges on database ds4fnp to ds4fnp;
Once this was complete, made sure that meltano.yml script changed under config:
config:
      user: ds4fnp
      password: "ds4fnp"
      host: 127.0.0.1
      port: 5432
      dbname: ds4fnp
then ran this to add loader as PostgreSQL database:
meltano add loader target-postgres --variant meltano
This added loaders section in meltano.yml file. Able to see particular target specified (ds4fnp PostgreSQL database).
With both tap and target set, able to define and run pipeline.
meltano elt tap-spreadsheets-anywhere target-postgres
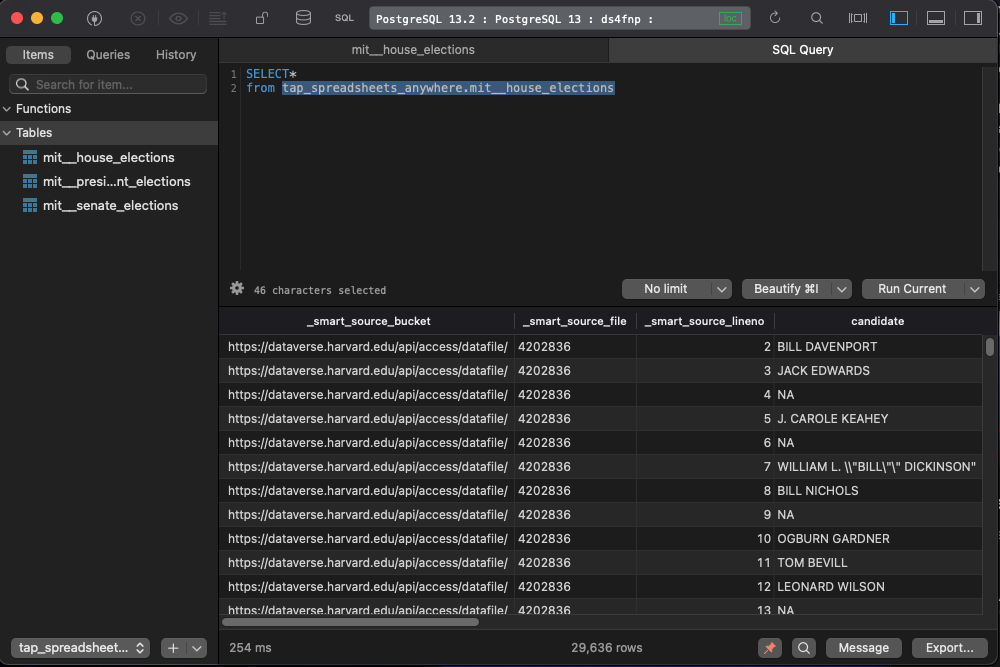
At this point, could see in TablePlus three new tables loaded in database with path:
ds4fnp.tap_spreadsheets_anywhere.mit__house_elections
Transformation
With “raw” data, there comes the need for transformation. Rawness means uncertain quality of data which we want to make into more immediately useful products. Initial transformations that interested me:
- consistent capitalization
- consistent name formats (Lastname, Firstname, keeping same throughout)
- not including metadata fields that were irrelevant for analysis
- aggregated data since raw data that came in had low level of granularity
Though changes were made to raw data, original was saved for historical/auditing purposes. This is referred to as preserving provenance of the data.
dbt stands for “data build tool”. It helped define and manage analytic workflows. Raw data was transformed using this.
Using dbt CLI:
pip3 install dbt
dbt init dbt
cd dbt
A new dbt project was created with configuration folder (.dbt) with profiles.yml in it. This file told dbt how to connect to the database.
Within the dbt project folder is dbt_project.yml file, README.md as well as a bunch of folders meant to store different forms of the raw data as well as documentation.
While working with dbt project, usually working with 3 main files:
- dbt_project.yml
- schema.yml
- .sql
The dbt_project.yml is almost exactly like the original one provided upon init, except for name of project, profile and models section. Under the models block, two different schemas defined: staging and elections. Staging were references to original data and elections folder had transformation models used downstream.
Defining Sources and Staging Tables
Staging tables are needed because sometimes we want to use the same tables in different data models. In order to prevent repeat transformations staging models are created.
Had to make a new folder under models: models/staging in order to define another schema.yml and staging tables. The first part of the staging schema file was to define our sources and at the bottom were where the staging models were defined. For each model, there was a name, which corresponded to a .sql file in the same folder. So in our case, there were 3 separate .sql files along with the schema.yml file in staging folder.
For each staging table, selected columns are pulled from source tables and transformations are performed.
Then elections tables were created for future analyses and Superset analysis. They are located in models/elections with its own schema.yml. Main difference in these table .sql files was that after the main FROM is: ‘ref’ and not ‘source’ as was the case when staging tables were defined. Also, election tables have aggregation versus data formatting.
Then all that is left was to run this in the CLI:
dbt run
Documents served by running the following commands:
dbt docs generate
dbt docs serve
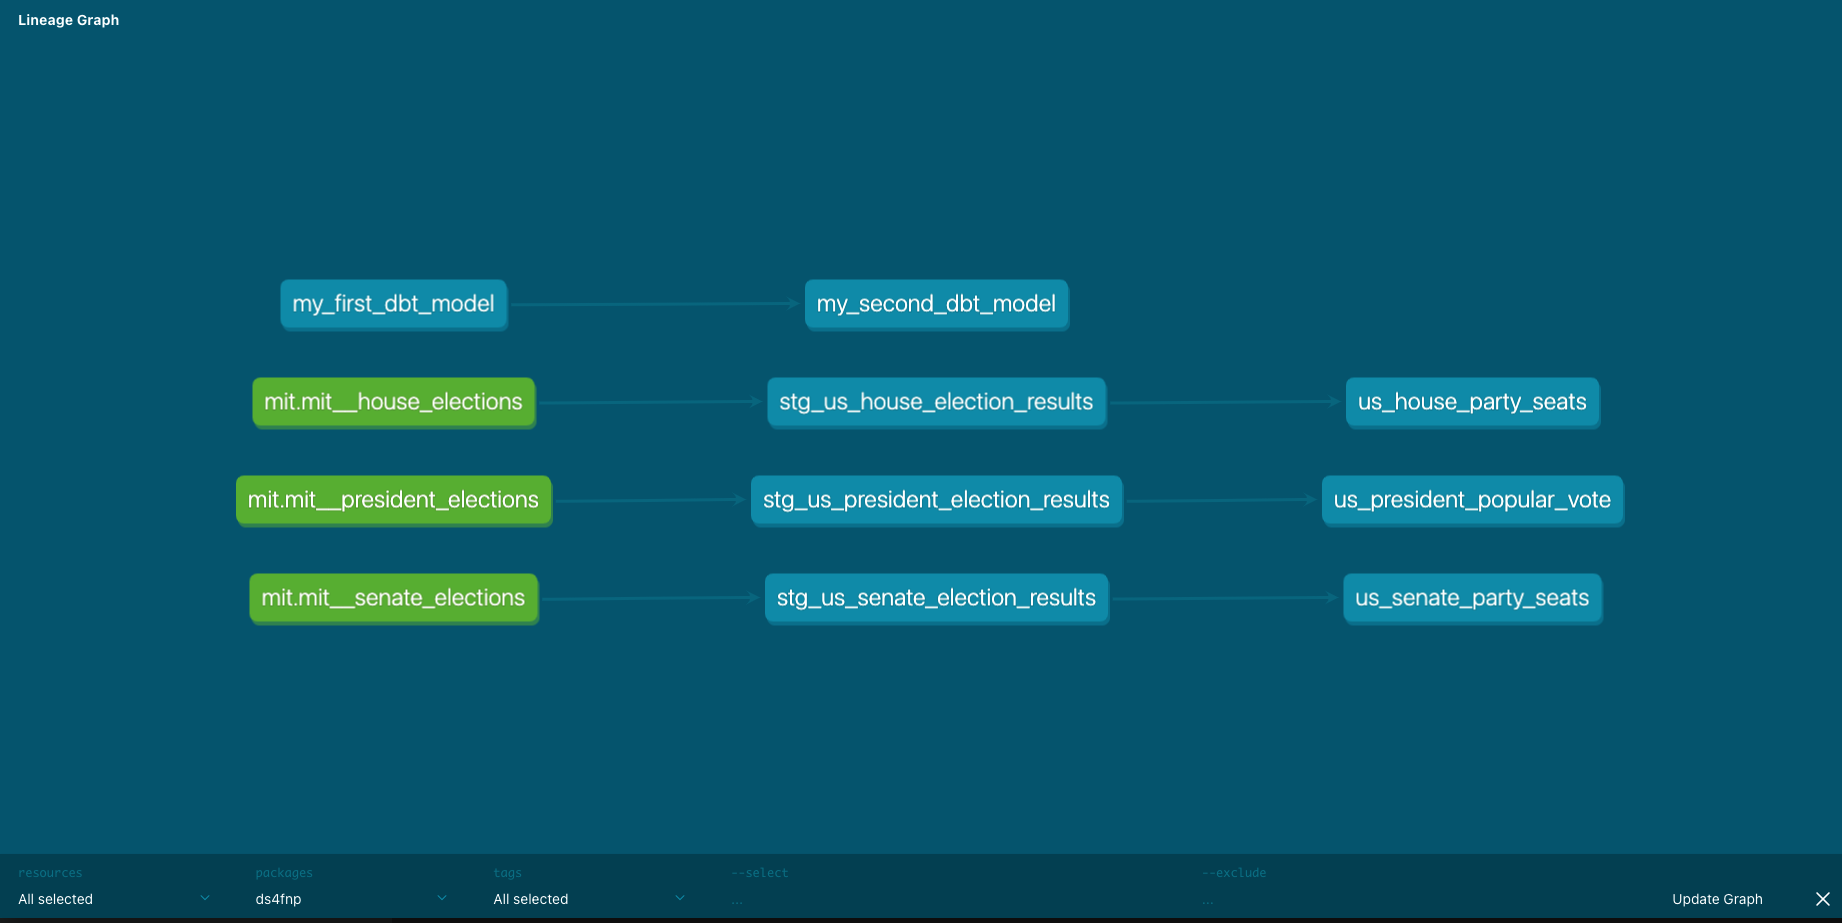
This generated data warehouse’s documentation and spun up temporary webserver for viewing. On the left side bar, could view all the different data models from raw to source to transformed. What was really cool was that I viewed a lineage graph of tables’ evolution from source by pressing turquoise icon on bottom right of page. This and documentation are highly valuable when projects get complex. And that can happen really quickly.
Visualization
With any analytics project, will have some sort of BI layer with interactive data visualizations. And usually these viz will be updated as fresh data comes in. So we could eventually modify our data connection to time when ballot counting is happening.
At the terminal, needed to run quite a few commands to make sure xcode and homebrew were installed, pip and setup tools are updated. Afterwards, installed Superset and created admin user and set a bunch of defaults.
xcode-select --install
pip install --upgrade setuptools pip
/bin/bash -c "$(curl -fsSL https://raw.githubusercontent.com/Homebrew/install/HEAD/install.sh)"
pip3 install apache-superset
superset db upgrade
superset fab create-admin
superset init
superset run -p 8088 --with-threads --reload --debugger
At this point, a running instance of Superset was up. Logged in with my user name and password. Then from there had to do what was familiar given my Tableau experience:
- Add data source
- Add tables
- Create charts
- Create dashboard
Configuring data source:
Just had to connect to data warehouse as data source by going to Data/Databases. Then under CONNECTION, put in ds4fnp for DATABASE NAME and this for SQLALCHEMY NAME:
postgresql+psycopg2://ds4fnp:ds4fnp@localhost:5432/ds4fnp
After data source was added, really cool feature called ‘SQL Lab” used where you can do some Exploratory Data Analysis (EDA) and quick ad-hoc analyses to aid development in Meletano and dbt.
Second, tables were added by going to Data/Datasets and clicked on +DATASET. I ended up selecting all staging data models and transformed ones.
Third, simple starter charts were created in order to get a feel for how aggregated votes were over time for Senate, House and Presidential elections. Did all this by:
- Under Charts: + CHART
- Selected a dataset: public_elections.us_house_party_seats and chose a visualization type: ‘Area Chart’
- When defining x- and y-axes chose year for x-axis with time grain
- Time range set to ‘No Filter’
- Under metrics, selected seats with SUM as aggregate (got rid of COUNT default)
- Chose to group by: party
- Set title
- Changed color scheme to “Google Category 10c” (under Customize)
Did this for all 3 models: House of Representatives, Senate and Presidential elections.
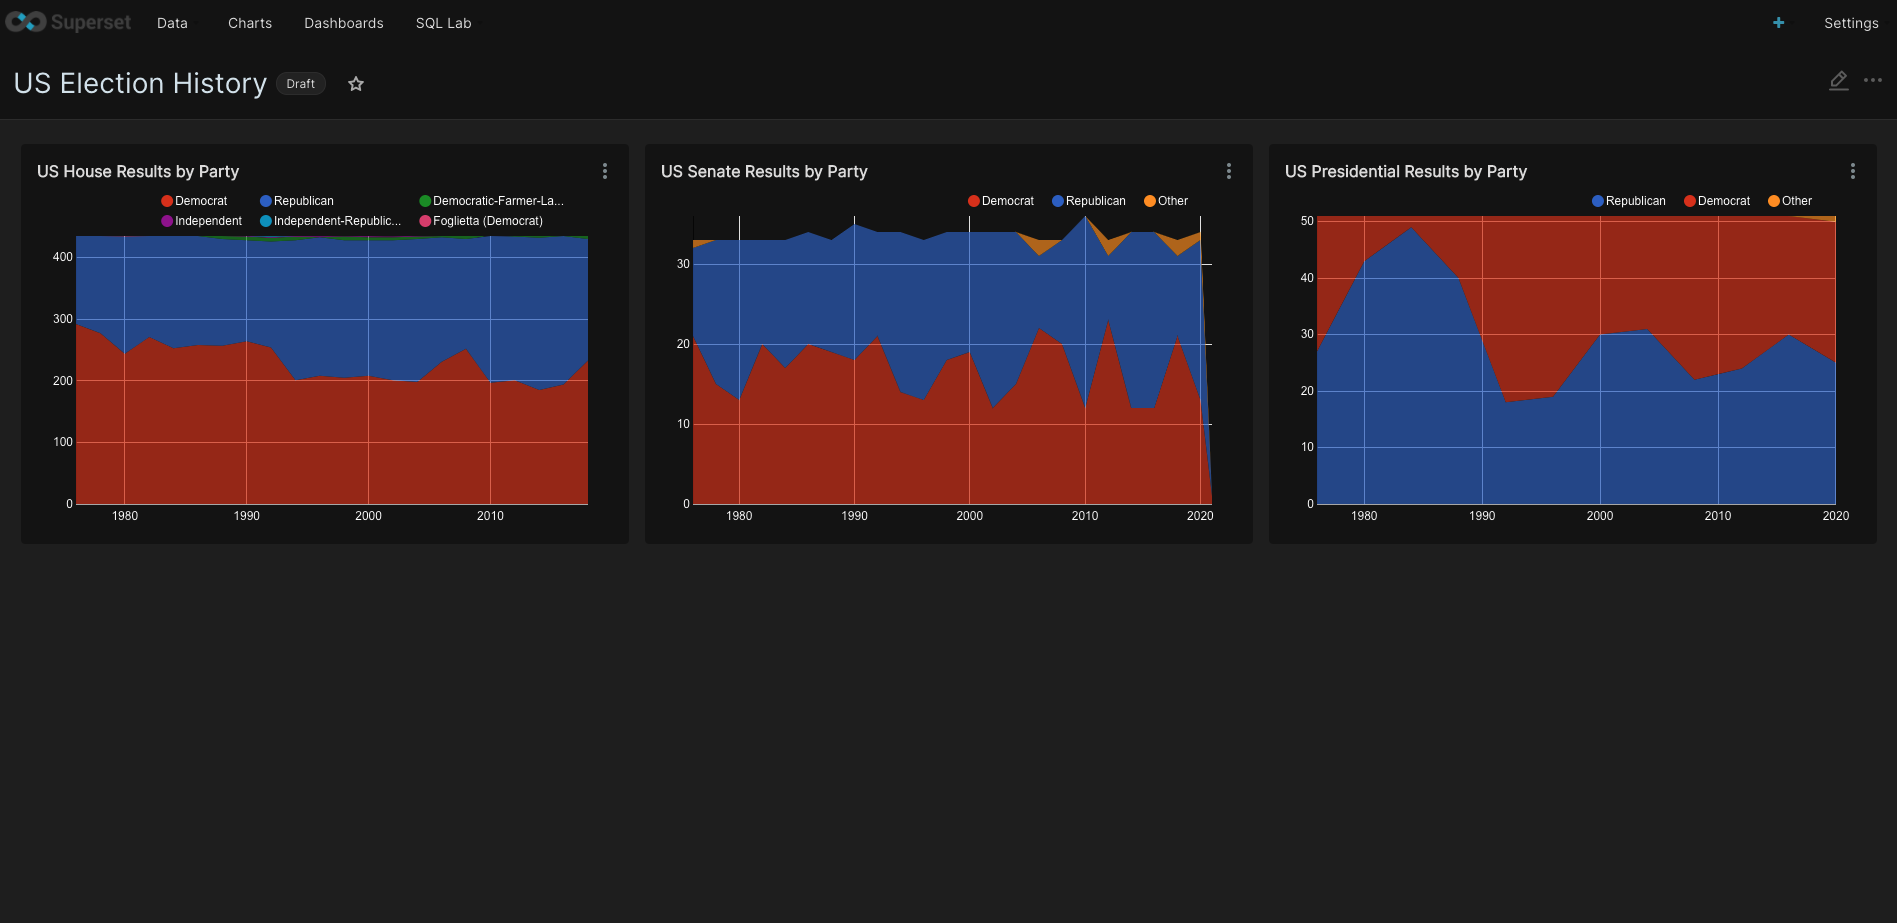
Lastly, to create a Dashboard, went to CHARTS (next to COMPONENTS) and added charts to plain canvas. Result was in one view: House, Senate and Presidential results all grouped by Party. Last things remaining were to add a title and save.
Of course, this was just the beginning. There is so much more you can do! :)
In the end, was able to from scratch: build a data warehouse (PostgreSQL), extract and load data into the warehouse (Meltano), transform the data (dbt) and create visualizations to present insights as a dashboard (Superset).