Business Problem:
For rideshare business Lyft in competition with UBER, it is important to understand how to maximize each customer’s lifetime with their product. By looking into the causes for loyalty and abandonent, Lyft can strategically spend to build features that keep customers engaged and retained.
Metric(s) to Measure/Change:
- LTV/Churn
Hypothesis:
By defining, applying and examining contributions to Lyft drivers’ LTV, will be able to reduce churn/increase retention.
Analysis/Approach:
Systematically go through analyzing Lyft’s business by performing the following:
- defining LTV
- contributors to LTV
- apply LTV for each driver
- Supply vs. Demand (drivers vs. rides), how increase of rides affect number of drivers?
- Churn and its predictive indicators
- attained/retained, retention cohort analysis
- business recommendations
Insights:
Used DuckDB again to do a lot of data engineering/data manipulation.
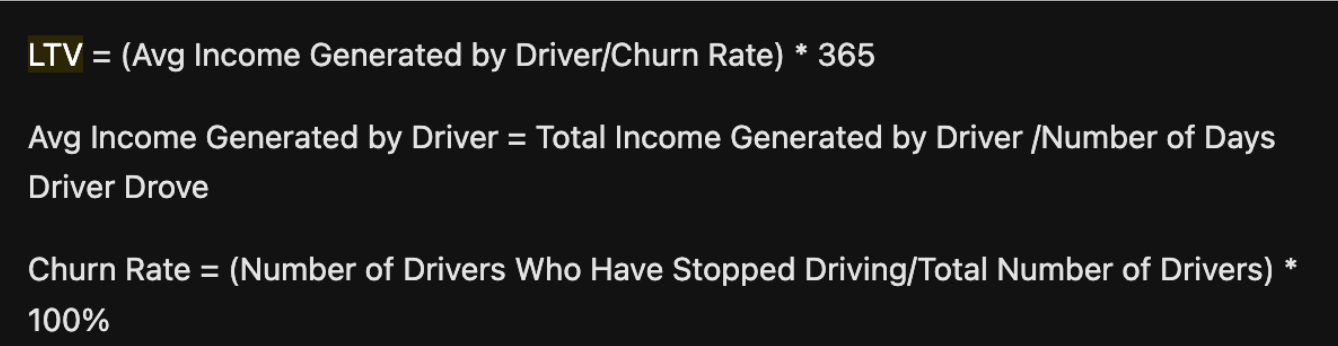
- Value of a driver to Lyft over the entire projected lifetime of a driver can be defined as:
- Main factors affecting LTV:
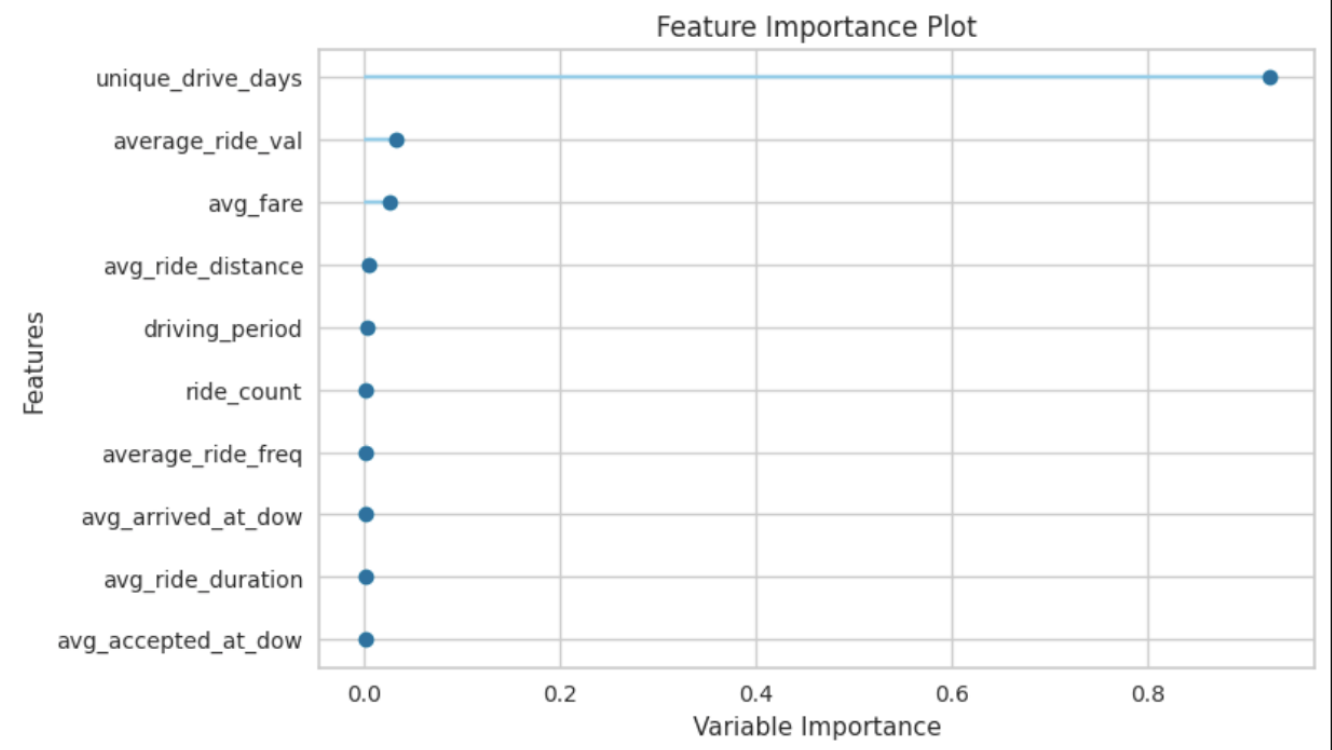
We can see in this chart that number of different days driver has driven for has the most impact on LTV. Some other factors include ride cost, usual fare for each driver’s ride, how long in distance each ride is, how long in duration each ride is.
- Main Factors Contributing to LTV Graphed Against It:
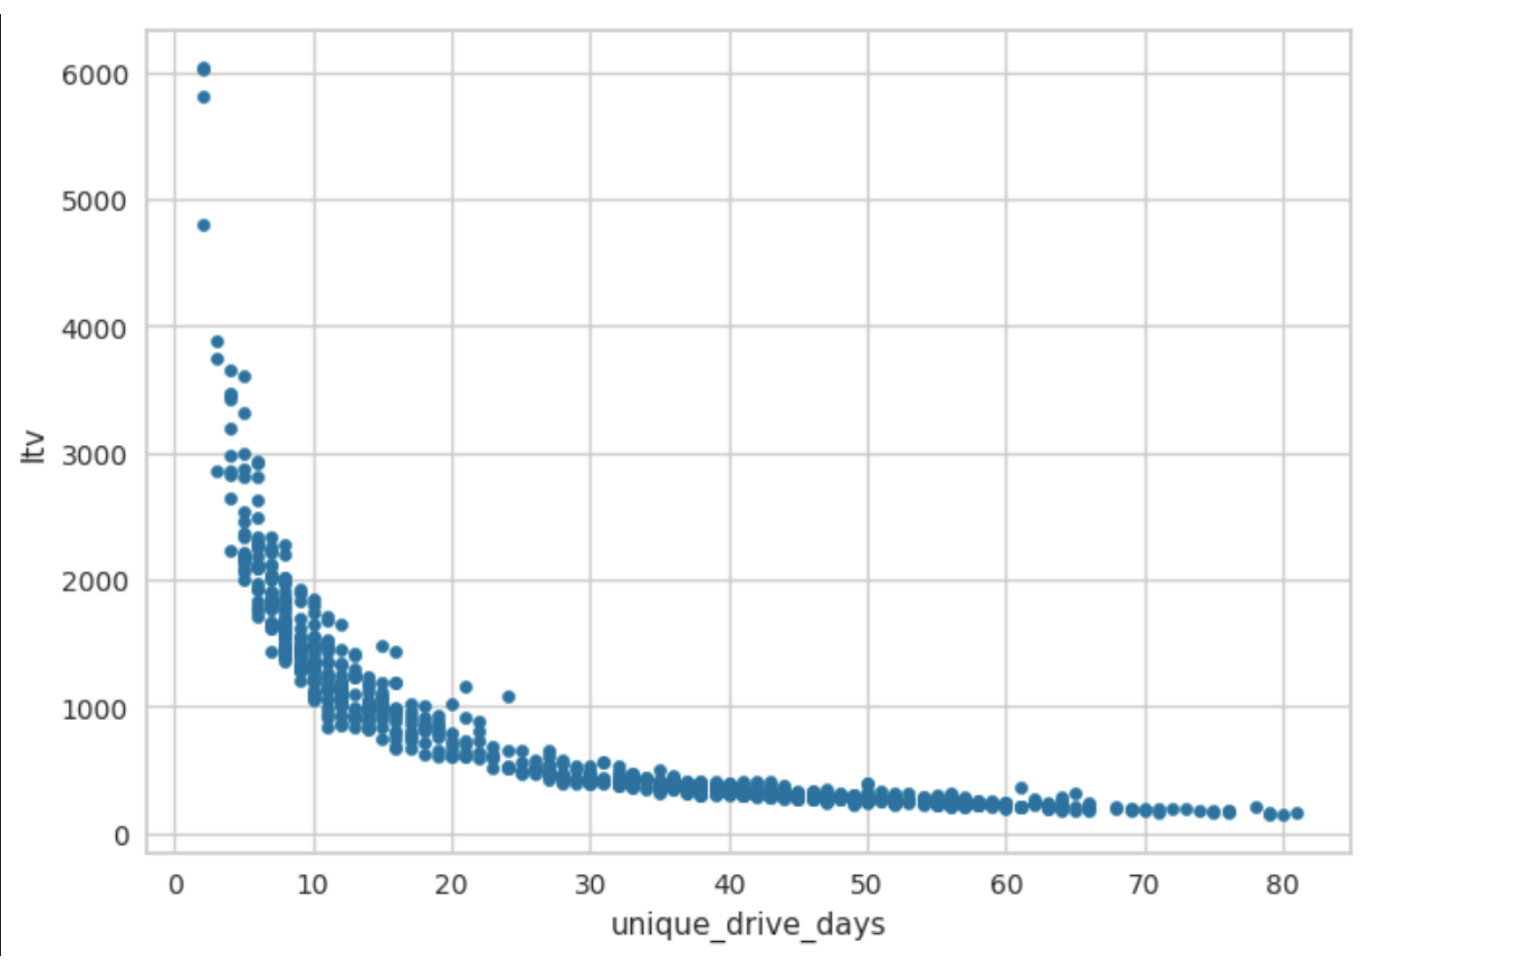
- Most interesting finding is that those who provide most value to Lyft drive the least number of days, which means whenever they’re out completing rides, they have a high volume of rides they are completing!
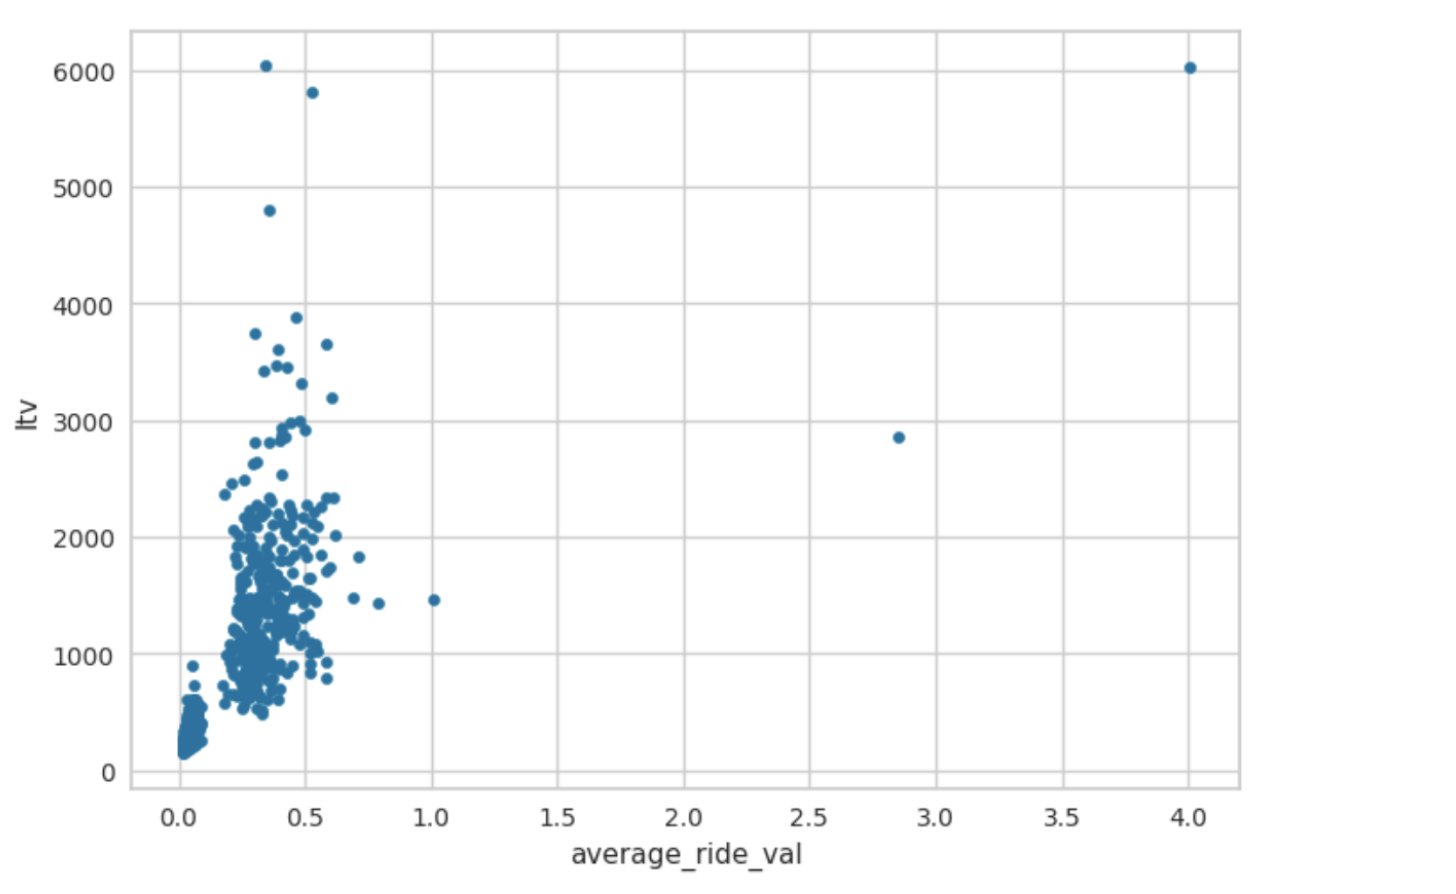
- Even the average ride value ($) does not have a strong correlation to LTV as would be suspected would be a strong indicator for high LTV.
- Average Lifetime of a Driver:

- This was determined by our churn rate
- Churn rate was determined by churn definition, which was driver who had no activity within 7 days from last recorded ride
- With churn rate determined, lifetime of driver defined as inverse of churn rate
- Supply vs Demand on Weekly Basis
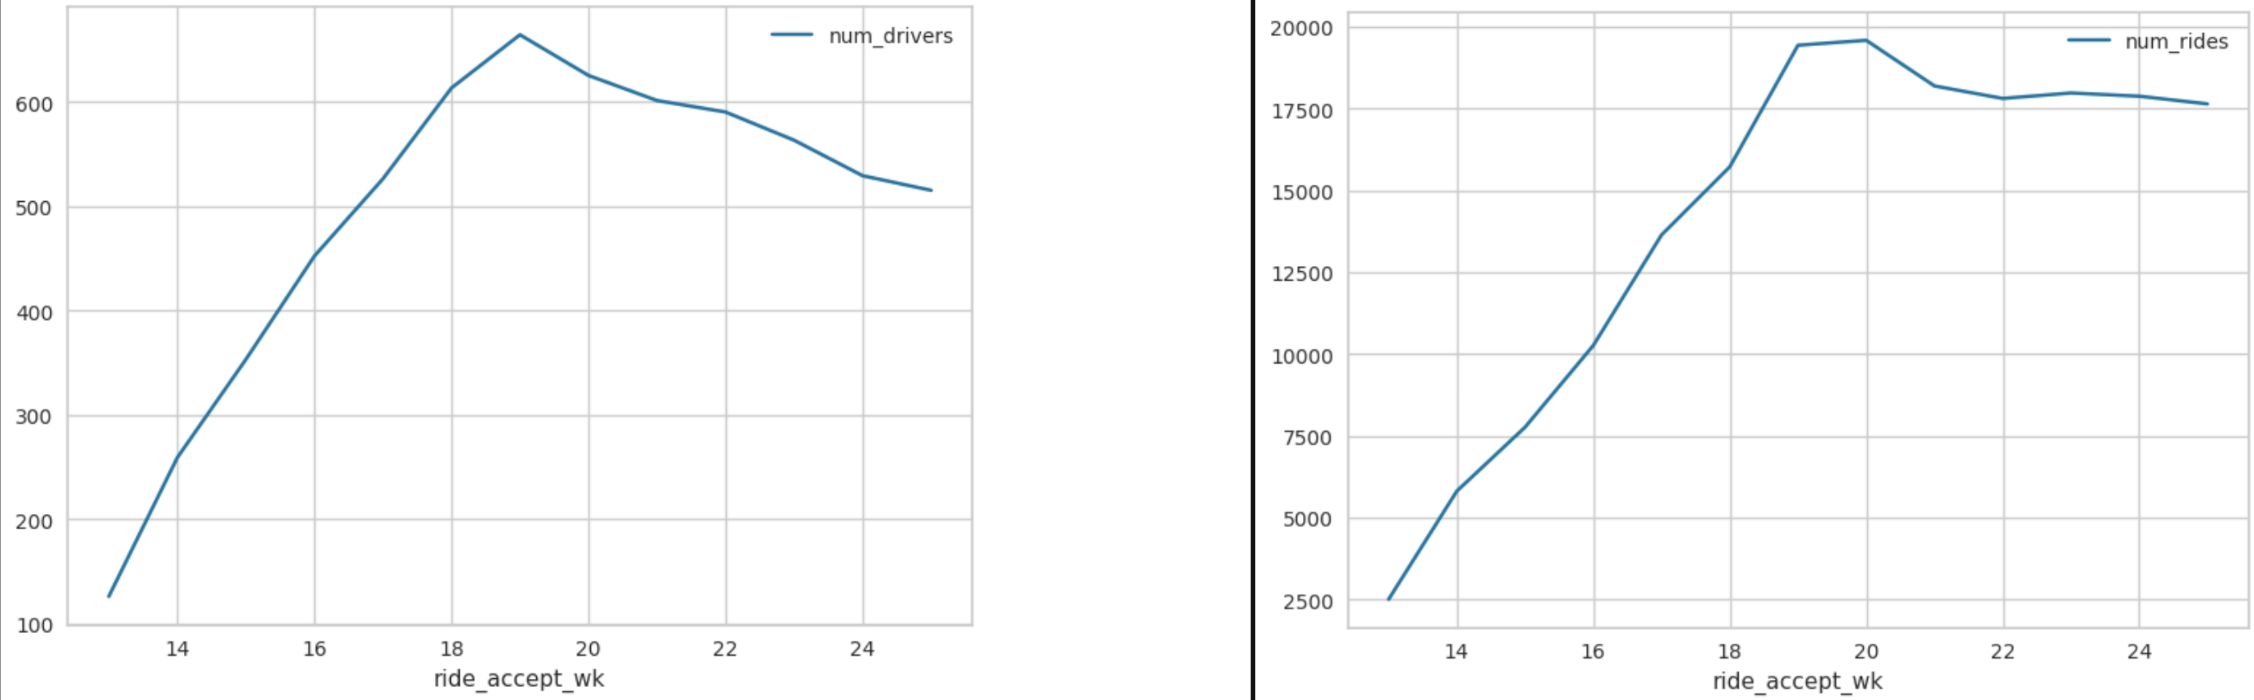
We can see here that number of rides trends with number of drivers until week 19 peak happens. Peak most likely due to promotion or maybe some special event. Afterwards, drivers head towards decline leading to marketplace imbalance.
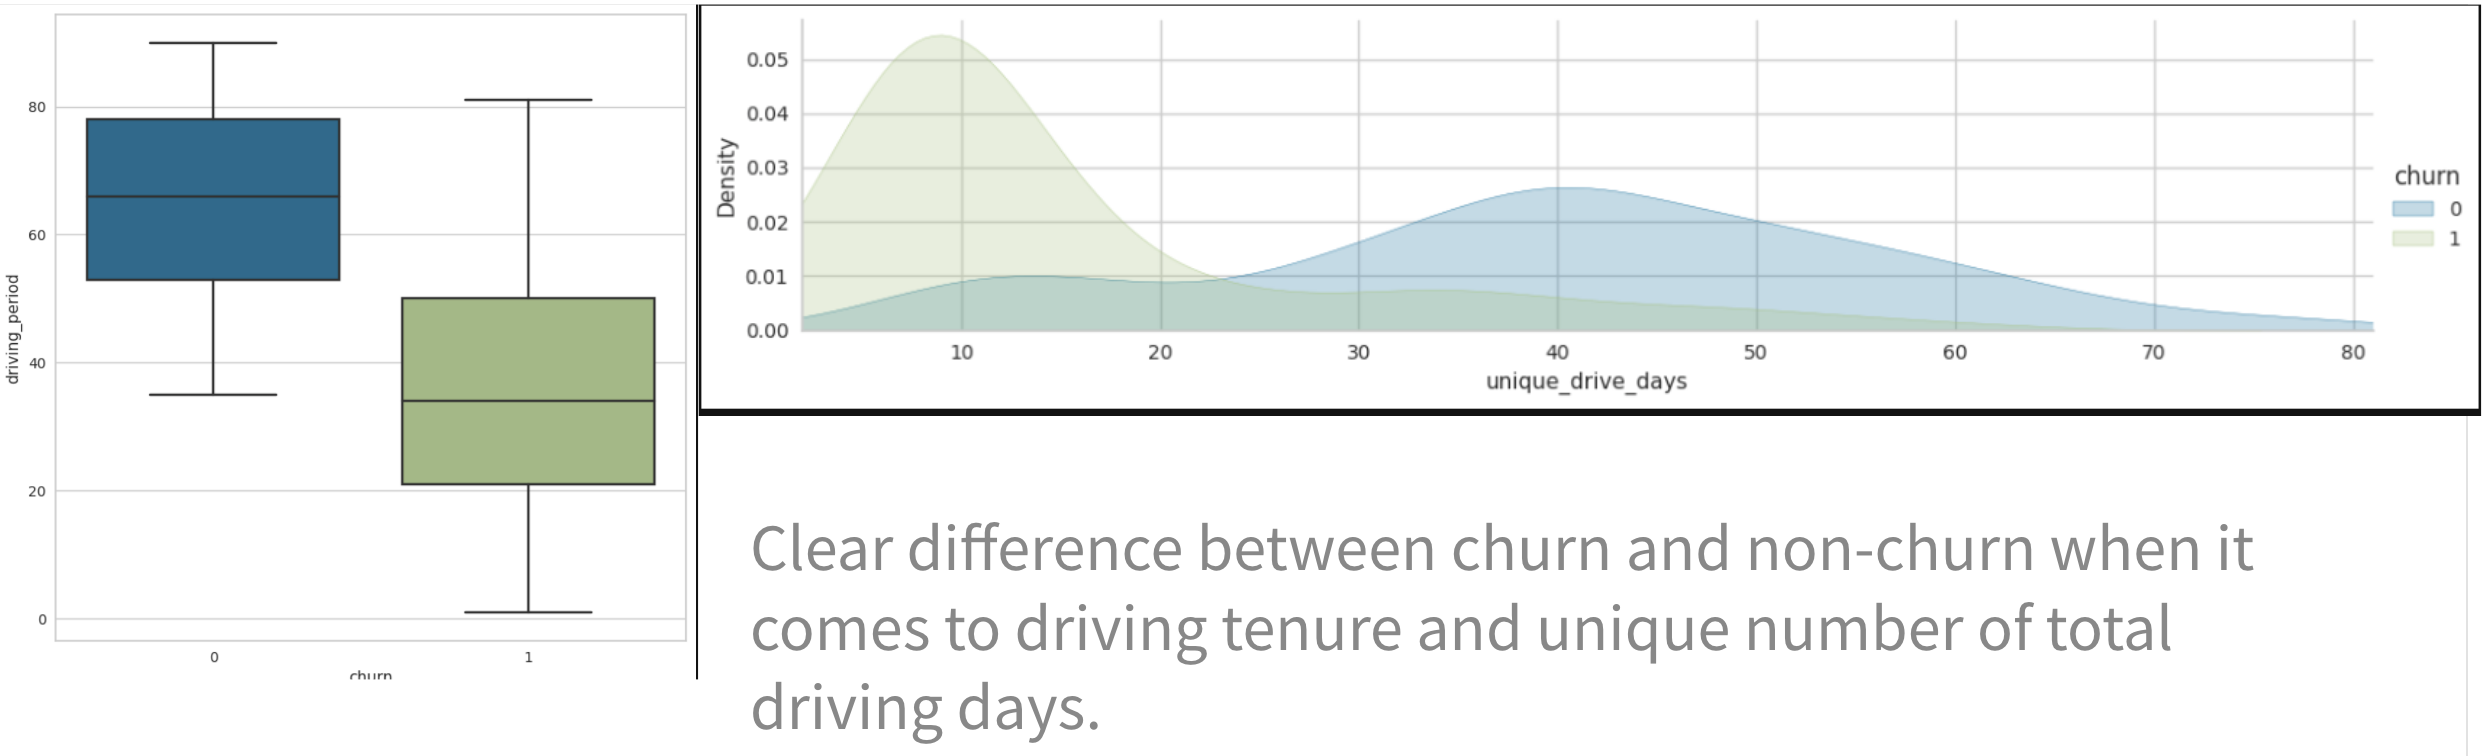
- Main Factors Affecting Churn:
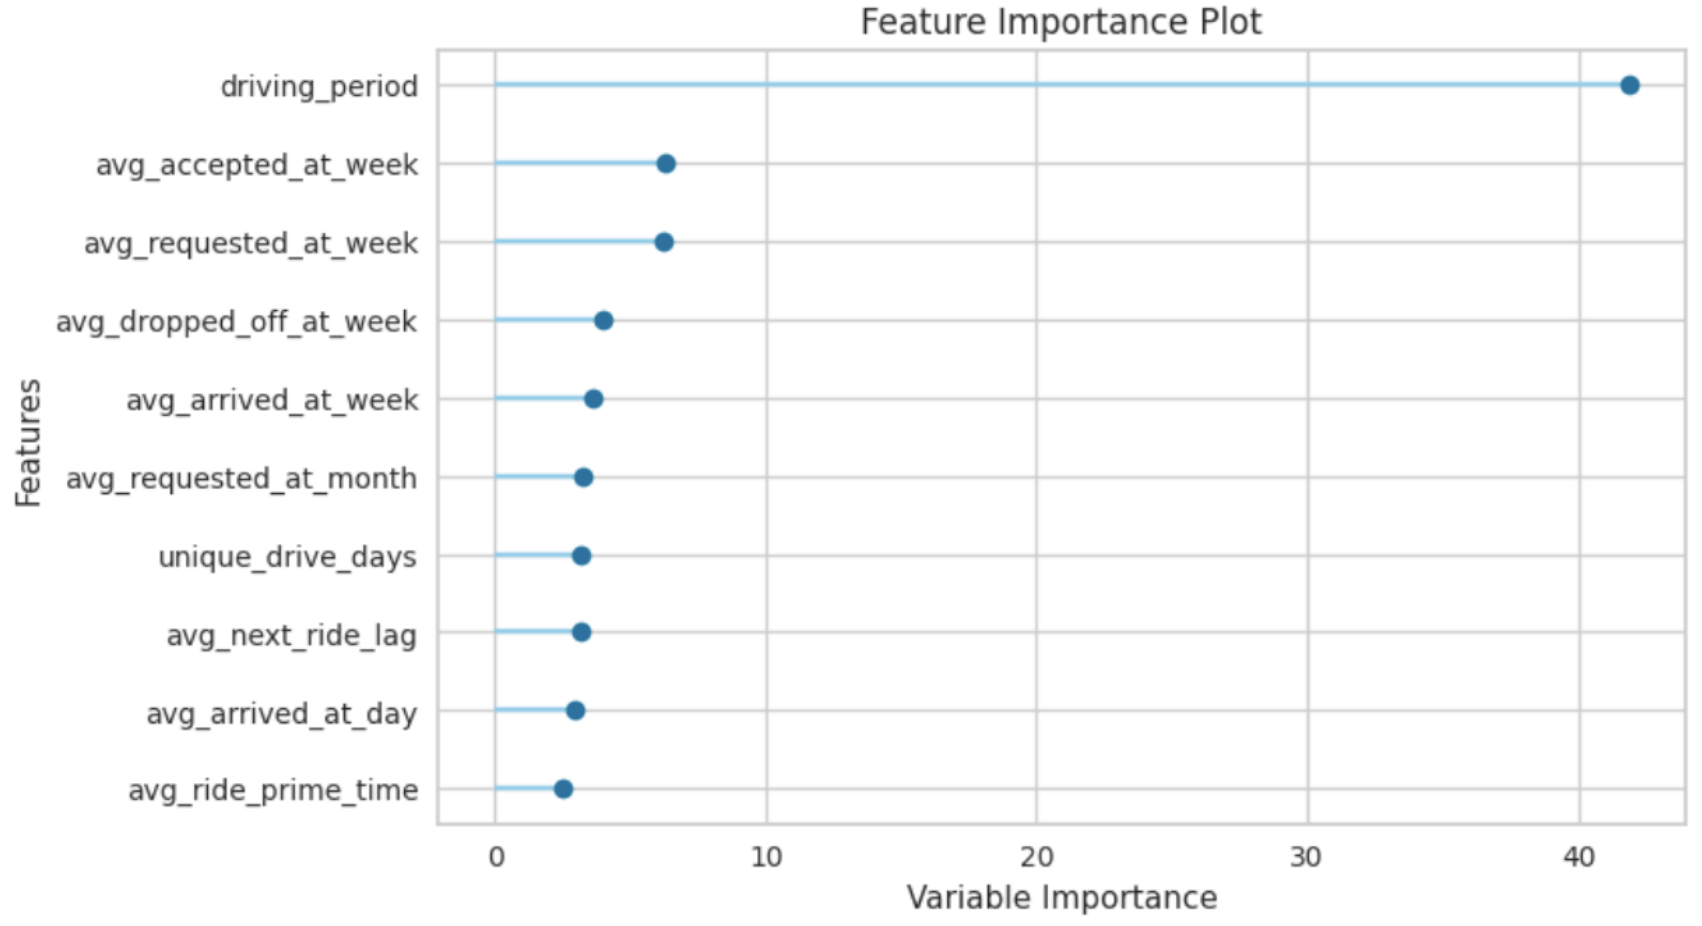
Driving tenure is the best indicator for churn. How long a driver has been on the platform/how long they have driven for is indicator for churning. Meaning those who are new to Lyft are the most prone to churning.
- Factors Driving Churn Split Between Churn and Engaged/Retained
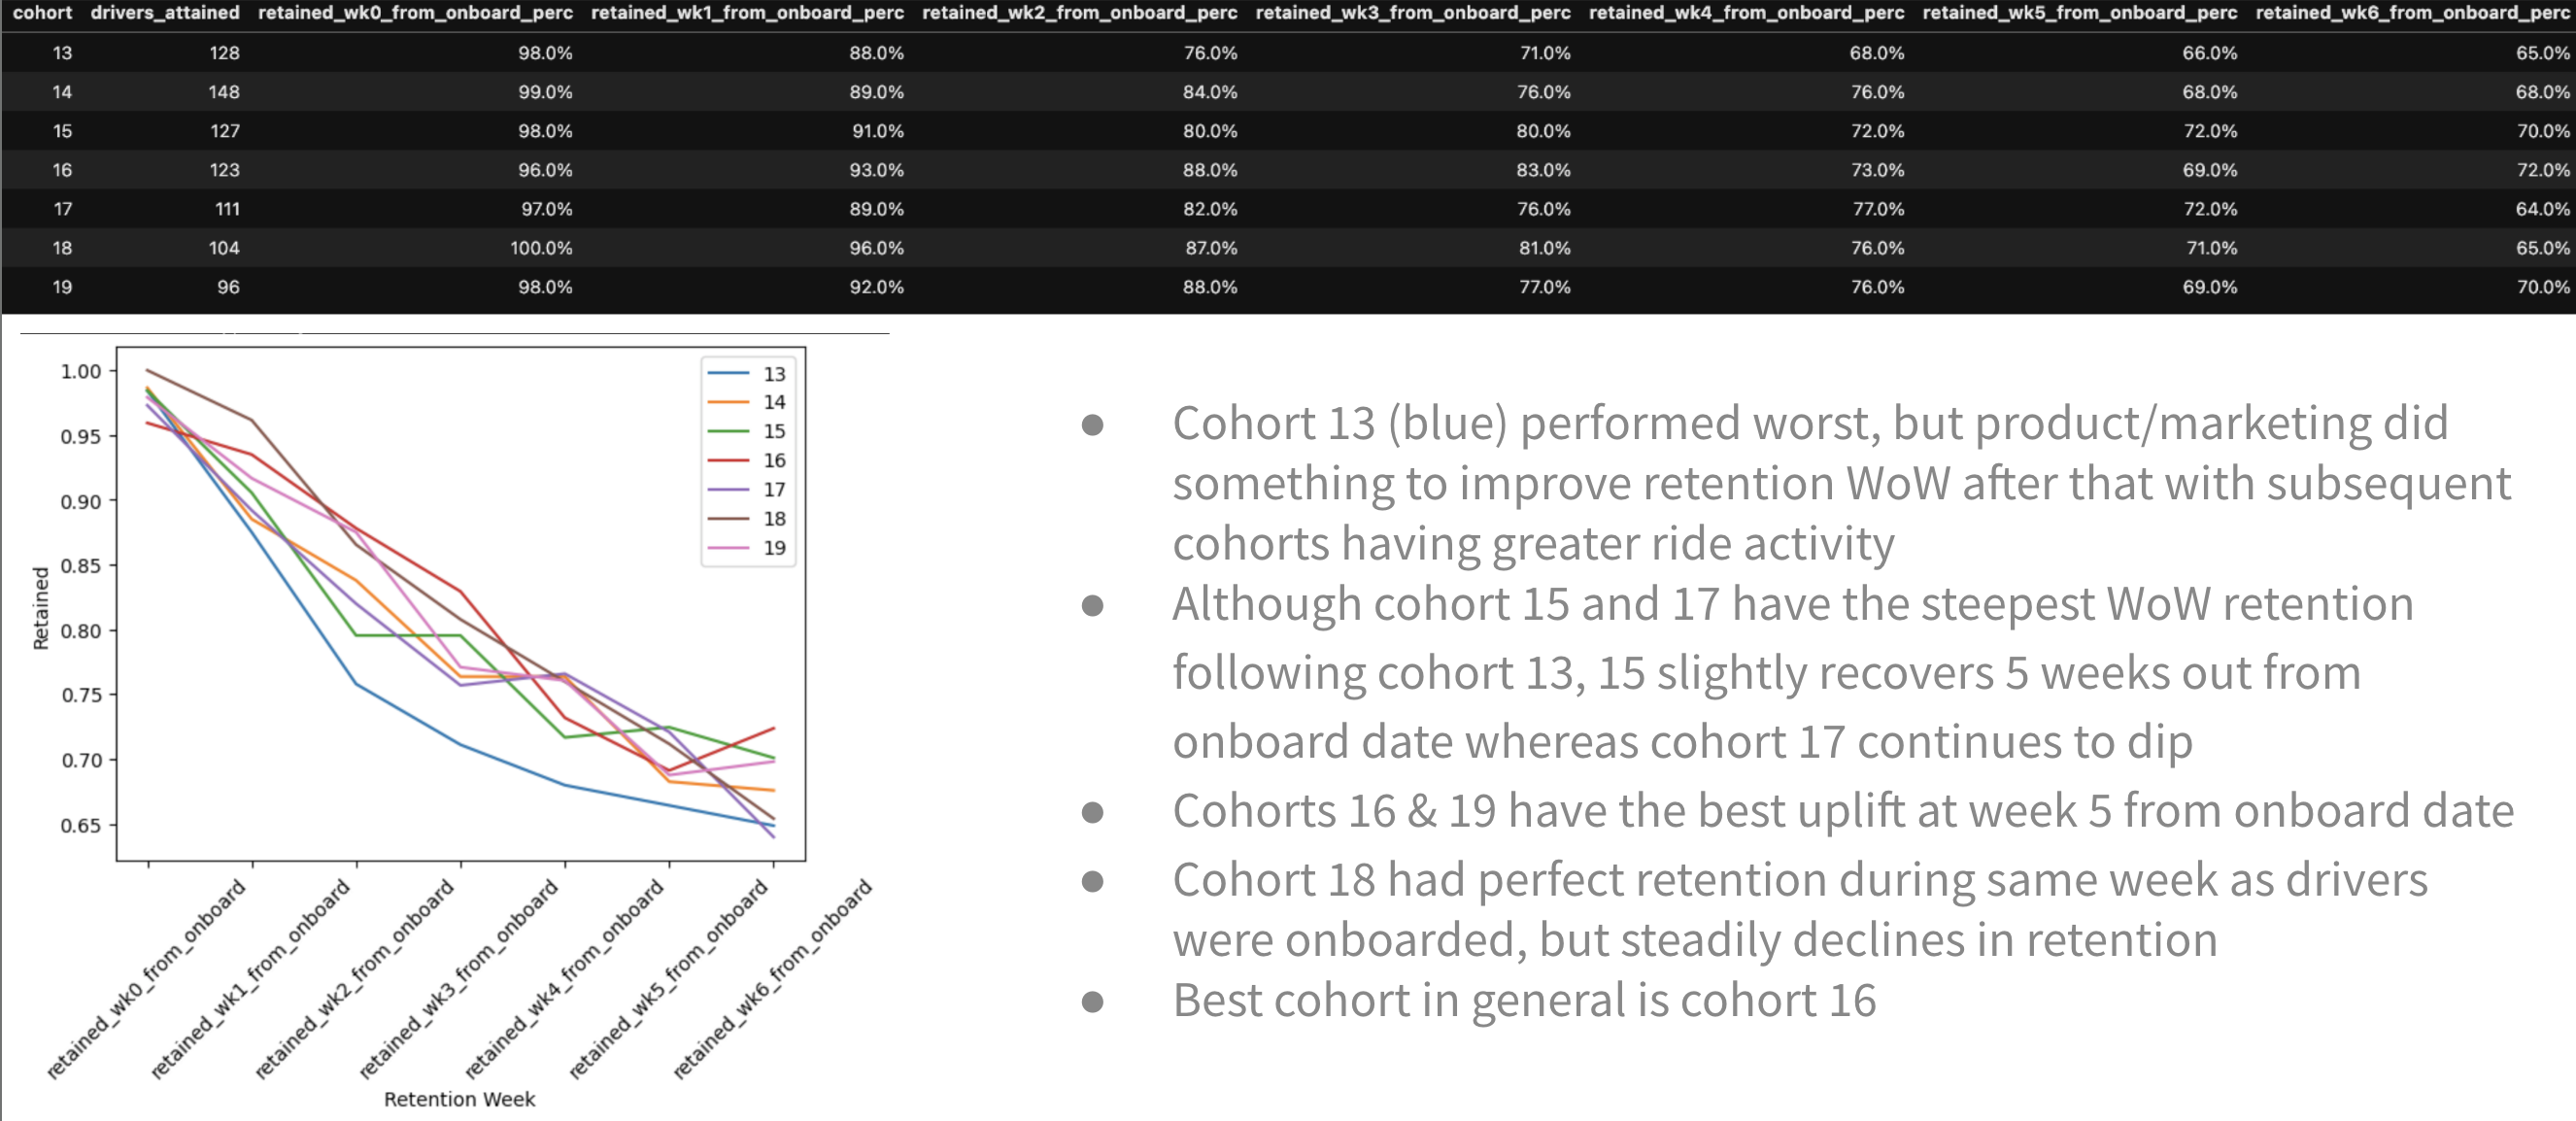
- Percent of Active Drivers By Onboard Week
Business Recommendation/Impact for Growth:
- Considering that those contributing most to Lyft’s revenue and hopefully profitable are those who drive a lot during the days they drive, would be best to reward these customers. This would incentivize them/reinforce this strategy of maximizing time out on the road. Possibly free/discounted tickets to events they like would be a good move to increase LTV/retention.
- In order to determine how to increase activity/engagement of churned drivers I would recommend a deeper dive into user journeys and see what behavior brought high LTV/power users from casual user to loyal Lyft driver. Further investigation needed to determine ‘ah-ha’ moment to safeguard against driver/supply drop-off.
- Also, looking into factors contributing to onboard week #15 and #19 would help bring supply to a healthy level to ensure supply is met in marketplace. Considering that a Lyft lifetime is approximately 2.5 years, at 2 year mark, providing some bonus in monetary or car maintenance reward would make driver feel recognized and supported and most likely carry-on as a Lyft driver.
- To increase retention rates, go heavy on incentives 1 week out from onboarding and whatever incentive/promotion was given for cohort 18 to start driving so quickly as well as for cohort 16 to have overall great retention rates continue to replicate that strategy since engagement was high during those times.