Motivation
It was not a surprise that OpenAI’s ChatGPT was a highlight in 2023 ever since its release in November 2022. I am a subscriber to Daliana Liu’s Newsletter, The Data Scientist’s Diary. In one of her blog posts called “Data scientists’ role in the age of LLMs (Large Language Models)” she said that even though LLMs seems to be a threat to the Data Scientist (DS) profession, there actually is a need for DS to measure LLMs’ performance. This was reassuring since it seemed like LLMs/Generative AI are taking over the world.
And as a Data Scientist, defining metrics are key to ensuring that a business is aligned with its mission statement.
Business Insights
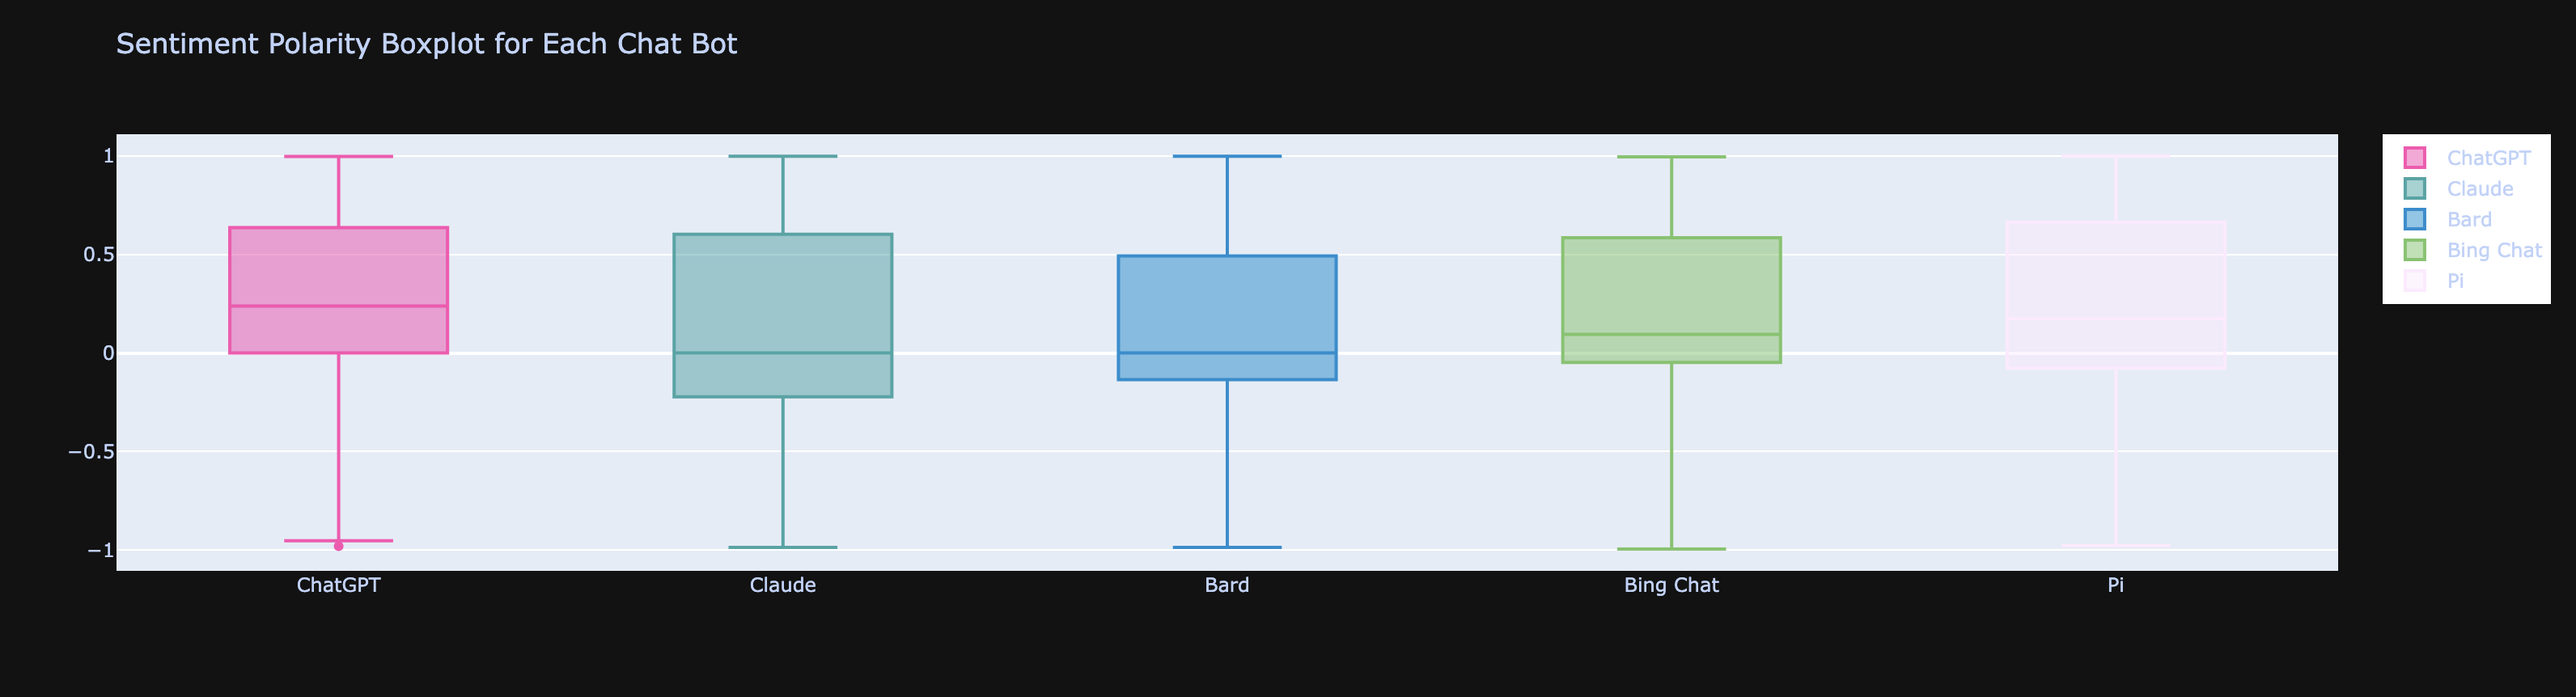
After performing Exploratory Data Analysis (EDA), wrangling dirty API/NLP data, I was able to determine that the overall sentiment on ChatGPT was mostly positive, as is evident from news/social media. What was surprising was that from all the chatbots compared, it was not ChatGPT’s competitor, Claude from Anthropic, second in ranking, but Pi. The assumption was that Claude would be right behind ChatGPT since its founders and majority of the early team were from OpenAI, the company behind ChatGPT. So those who left OpenAI for Anthropic probably helped build out ChatGPT’s first features/MVP. I believe Pi is an unexpectedly favorable ChatBot becomes it offers more of a human experience.
Caveat about conclusion is on limited sample size and not having even sampling from YouTube and Reddit. There was more chatter on social media about ChatGPT, but there could have been more data scraping for other chat bots. Imbalanced data between chatbots could easily skew conclusions as sentiment per chatbot. One workaround is to do sentiment by percentage of population.
Another motivation behind doing this sentiment analysis was to have something to complement the usual A/B tests. From my experience and common web analyses, user behvior is just measured by their actions. This can only provide a small window into a users’ favor/disfavor towards a product offering. Coming from product anlaysis and seeing this limitation, I wanted to get a more comprehensive view on users’ response to a product/updated features.
Business Recommendations
Given ChatGPT and Pi’s popularity, competition remains stiff. This is not including Bard and Bing Chat/Co-Pilot who have a lot of runway. Competition breeds innovation. Doing this analysis on user comments has reminded me that YouTube and Reddit are great places to see what is best to work on, not just examining past launches and peforming descriptive statistics. Predictive measures can be taken as well. And the ones who seek out the best next move and build fast will triumph and become the industry leader and experience higher user adoption and retention.
Code
Personal Data Growth/Fun Lessons
Data Collection
I had no idea this project would be so interesting! Starting from data collection, I bumped into this awesome, aspiring DS’ repo called Complete Life Cycle of a Data Science Project. This began my introduction to scraping web data. Now I have a better understanding of Data Engineers’ jobs and can self-serve wben needing to get data from the web. Instead of working off Kaggle-esque syntheized data, I had the power to pick my sources and have a better understanding of why the data would be wonky because I was the one who retrieved the data. For this analysis, I specifically worked with YouTube and Reddit API’s.
Data Cleaning
Cleaning text data was a growth opportunity. It was good to get back into it since user comments are excellent signals to
get a pulse on users feedback. Though working with natural language can get tricky. So if I got familiar with it again, then I would be able to
wrangle cleaner data with ease.
While refamiliarizing myself, I got to learn about advised social media text cleanings - translating emojis/slang and expanding abbreviations. This added a whole new layer of complexity to NLP wrangling, but was interesting to implement.
Below were the steps I took to clean up the original comment text from YouTube and Reddit. To see the differences, compare text
column to clean_text column.
Cleaned HTML tags:
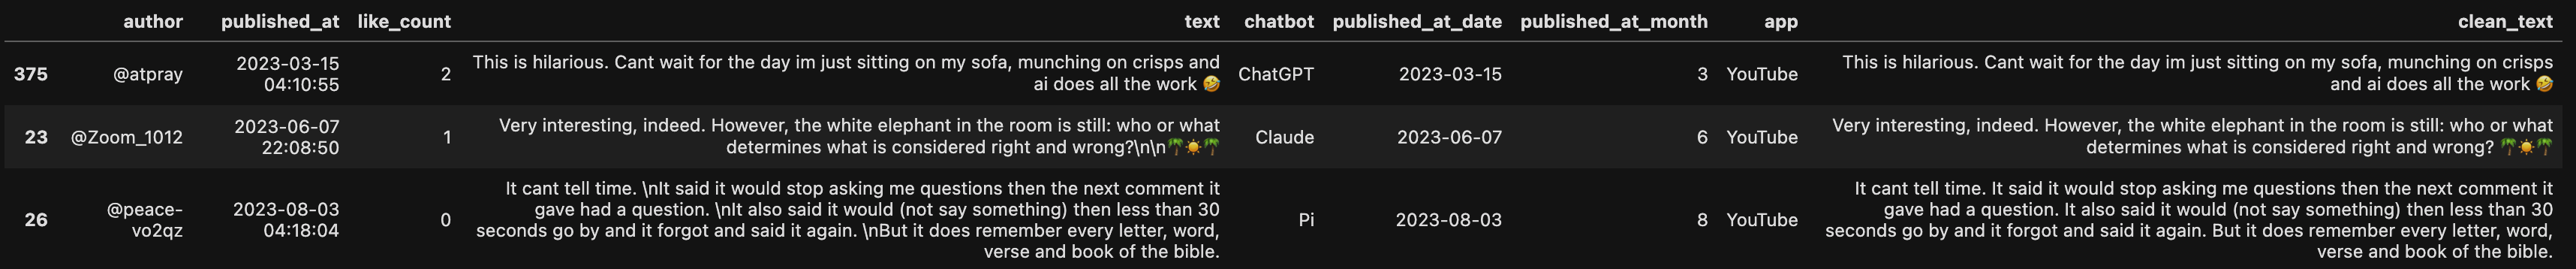
Translated Emojis:
Expanded social media abbreviations such as ‘lol’:
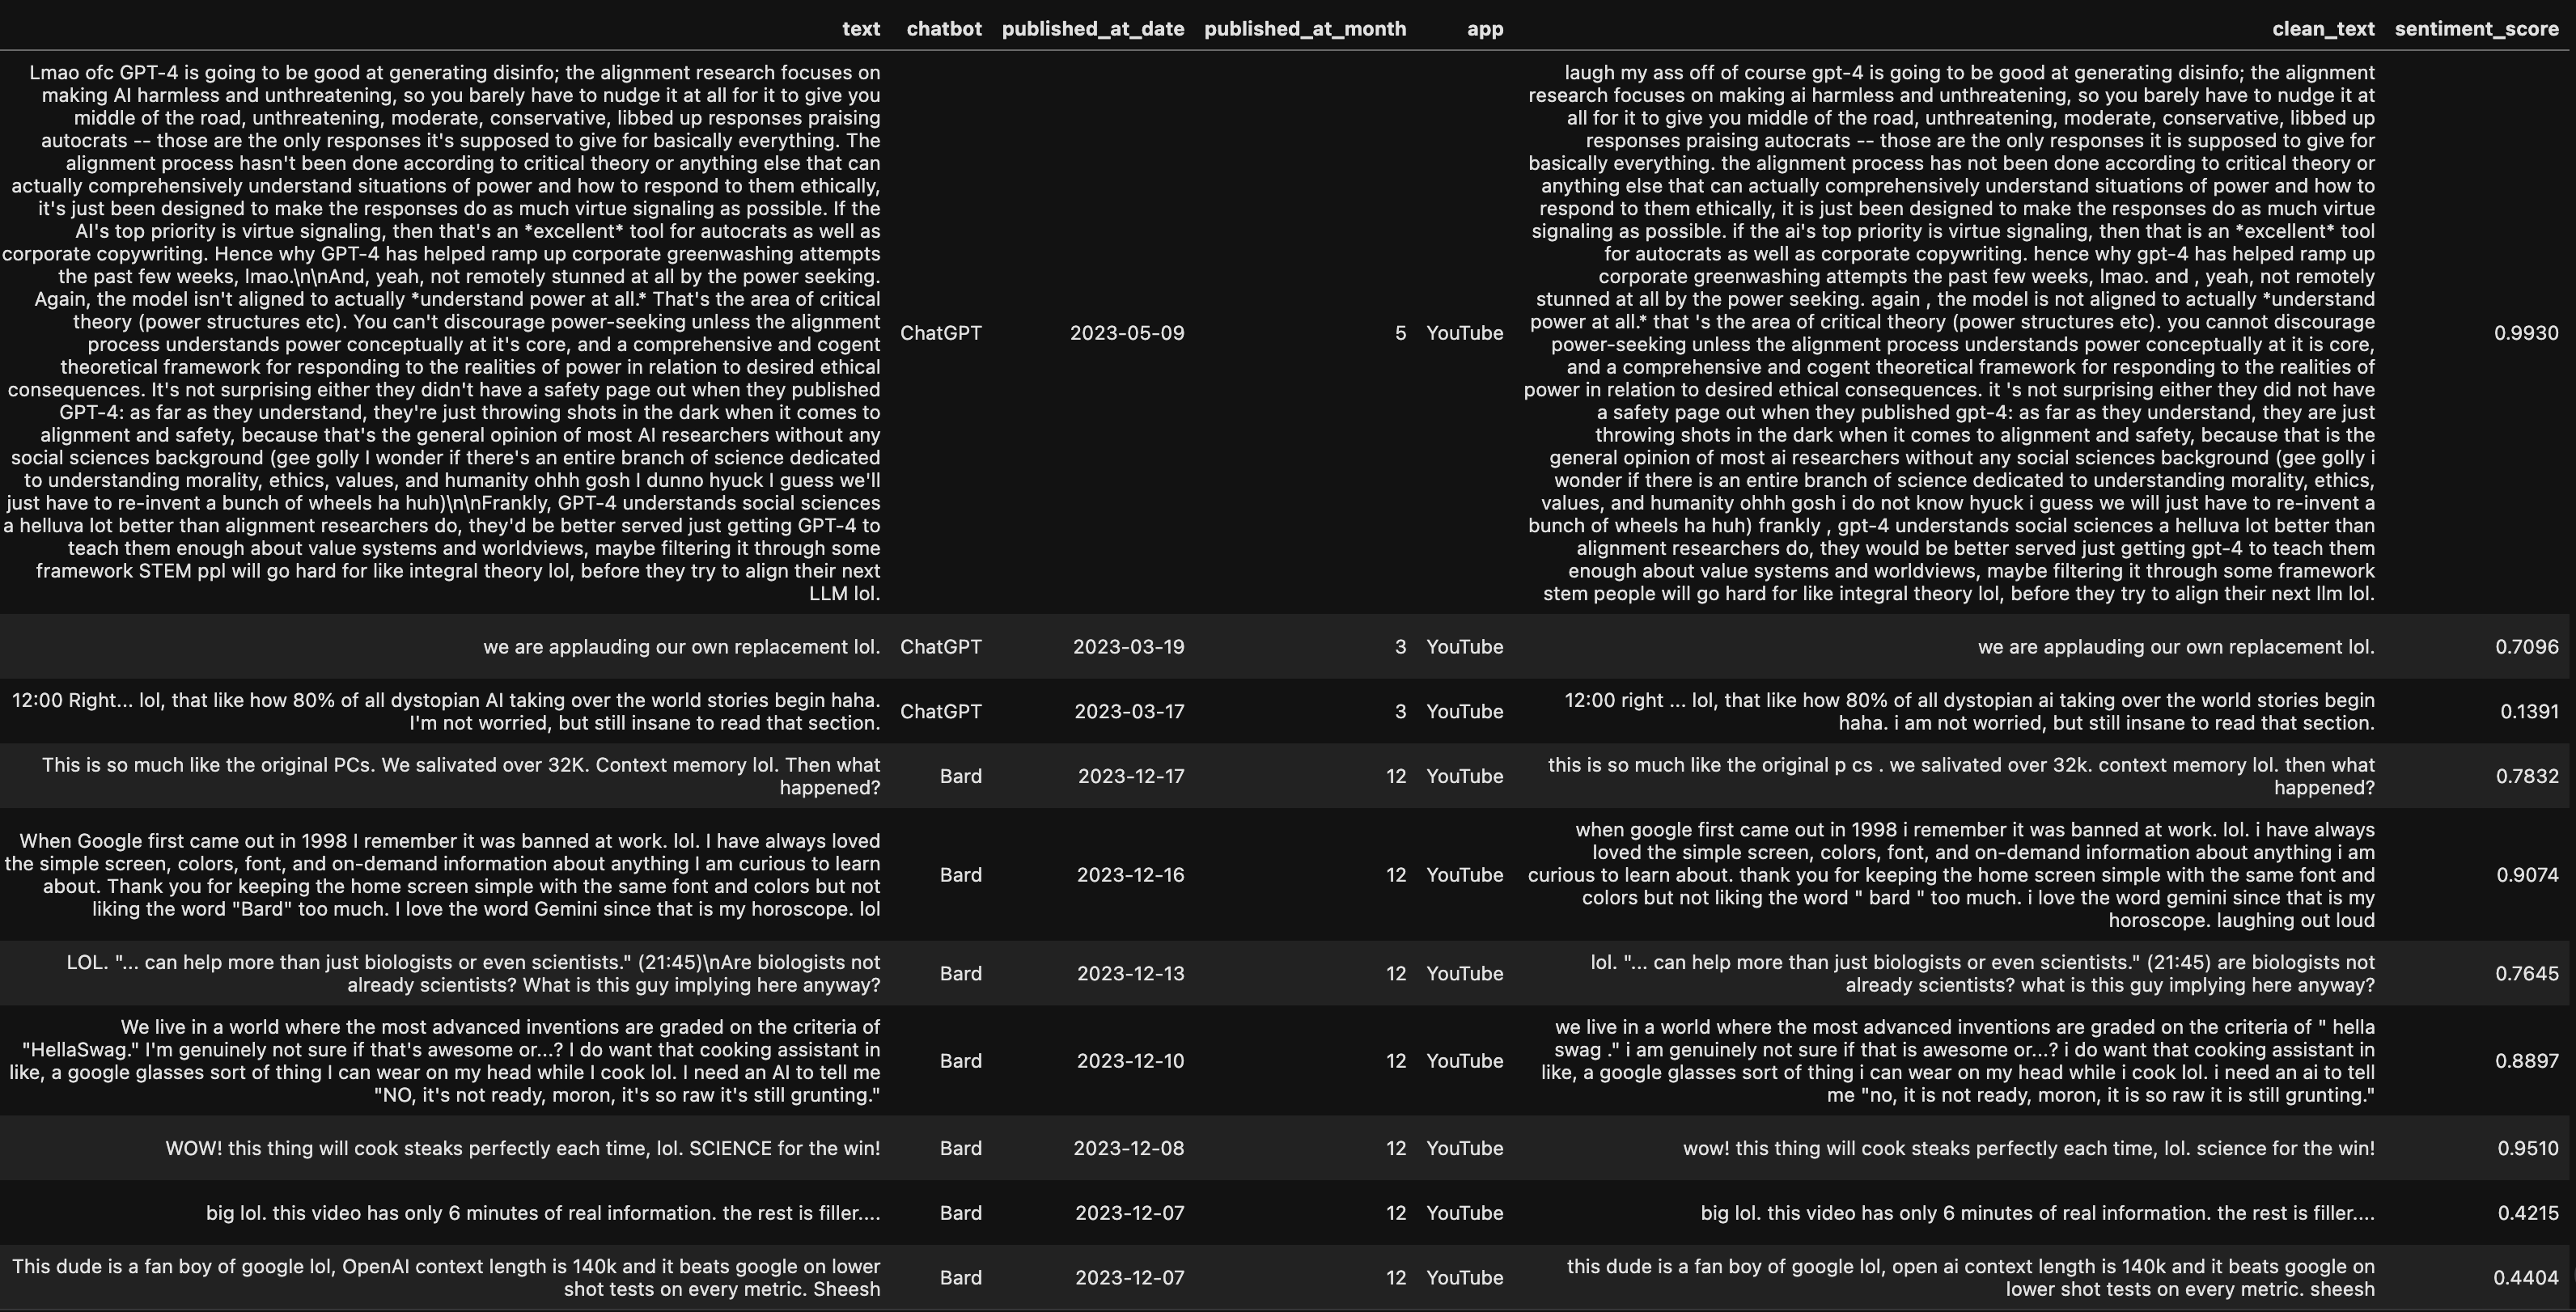
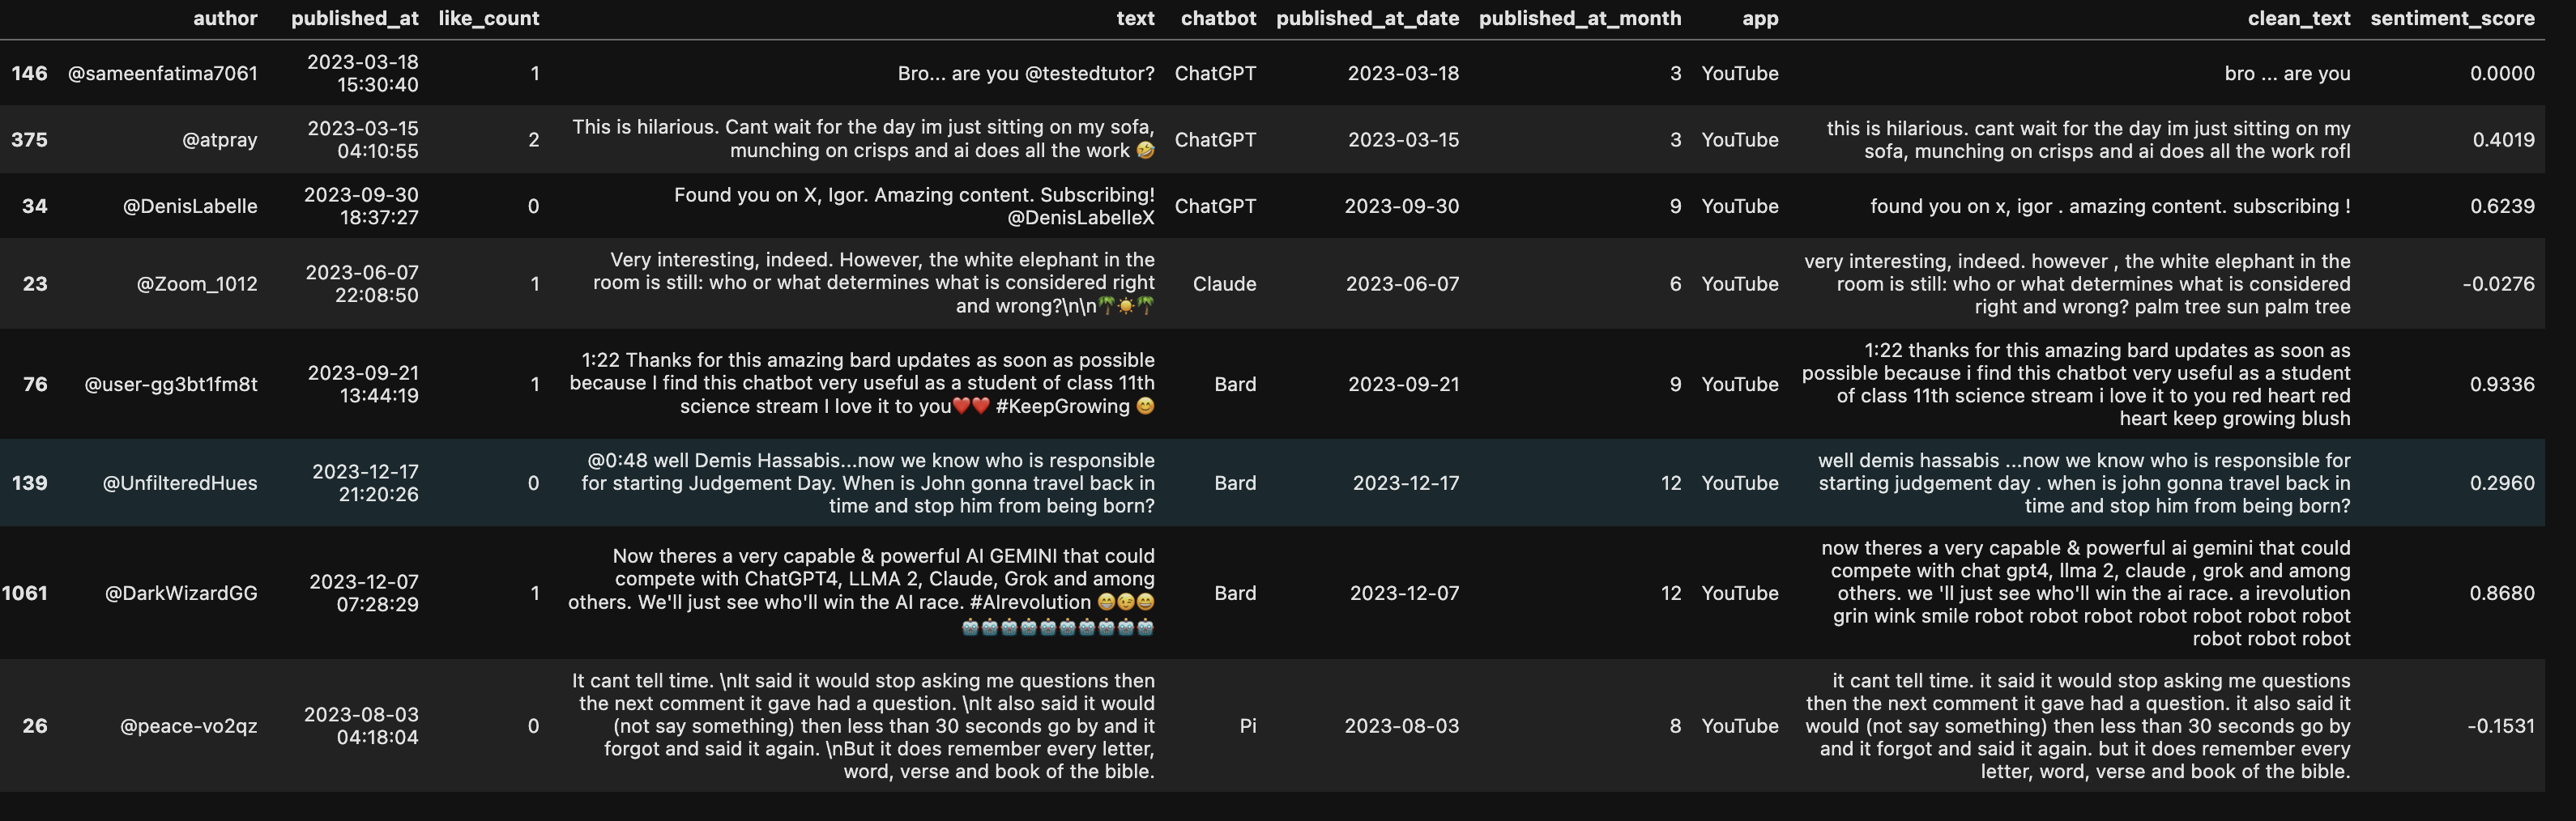
Sentiment Scoring
This was a really cool experiment as I tested different sentiment libraries: Vader, Hugging Face’s Happy Transformer, TextBlob and even Google’s NL API. I ended up choosing Vader because it specialized in social media data (could handle emoji’s and slang), but also Happy Transformer and Google’s NL API lacked huge context window (did not allow for large commments). And TextBlob lacked accuracy when it came to sentiment scoring.
Visualization
When it came to graphing sentiment, I had to lead with questions that were specifically tied to sentiment of chatbots. The goal was to extract words/phrases that were tied to the metrics of success broken down by sentiment. Then helped with sentiment mapping to features that had the most ROI.
Realized context was king since unigram and even trigram wordclouds and bar charts lacked signal.
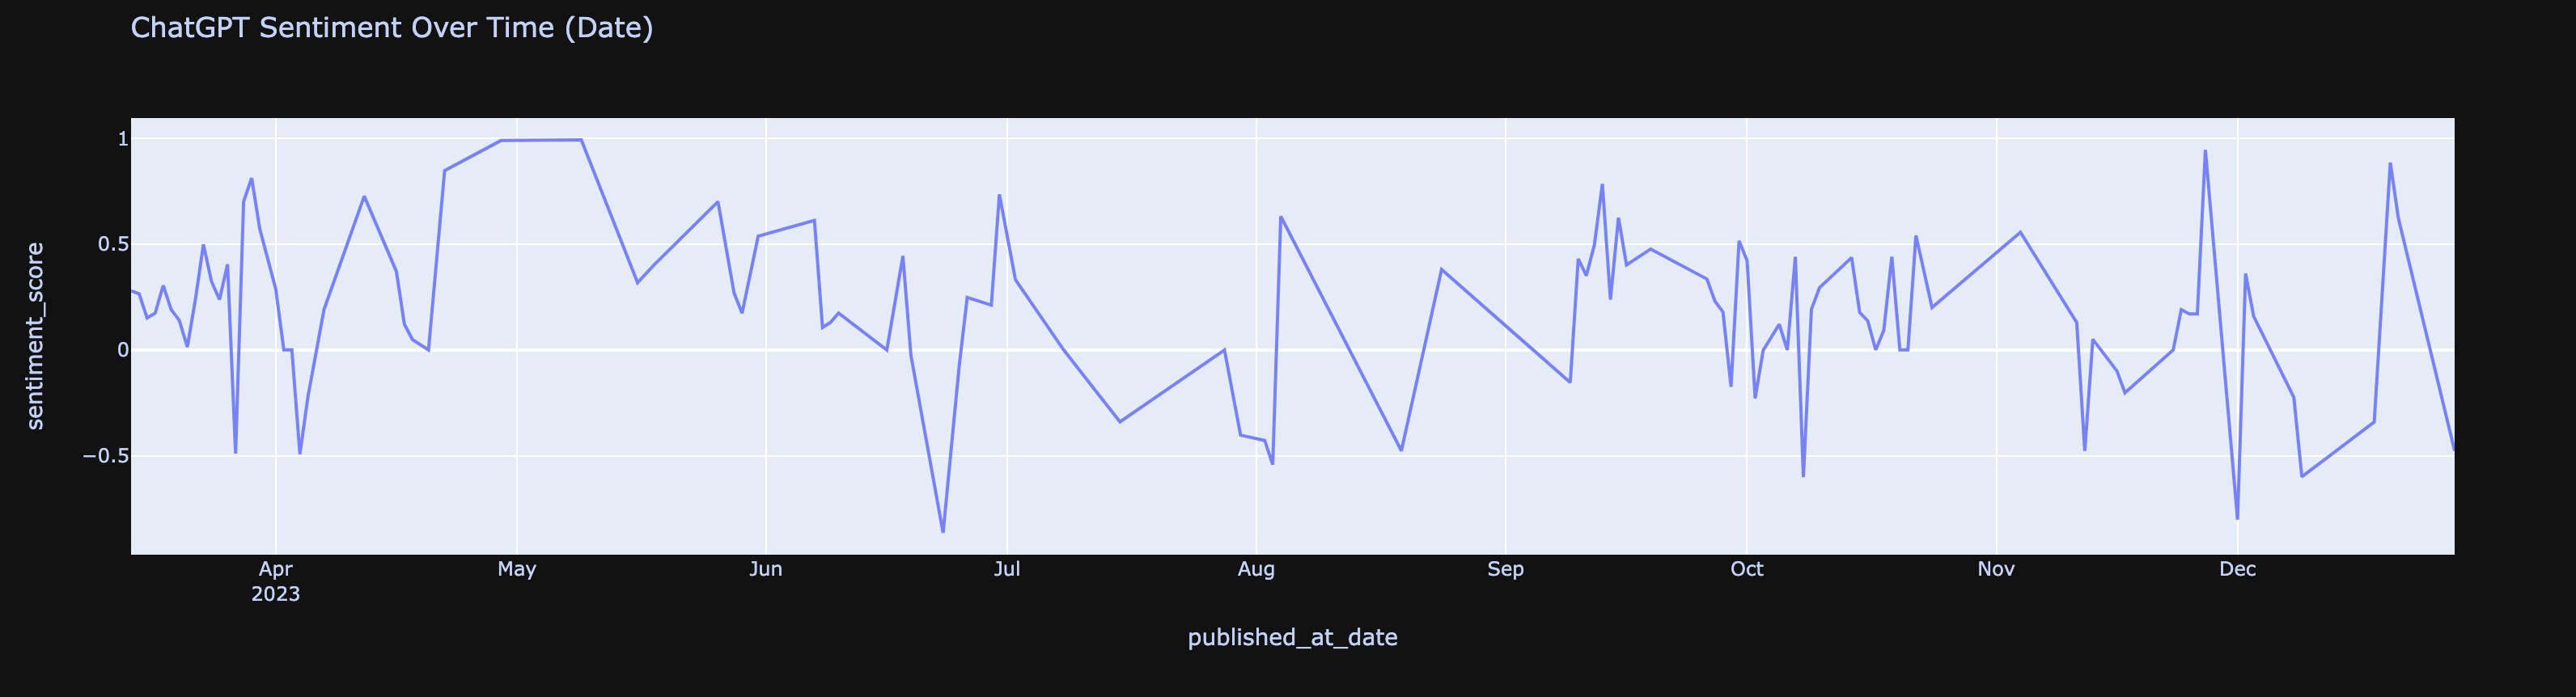
So I quickly moved onto other graphs that were tangential exploratory questions in general. They are pictured below.
Sentiment Time Series:
Sentiment Boxplot by Chat Bot:
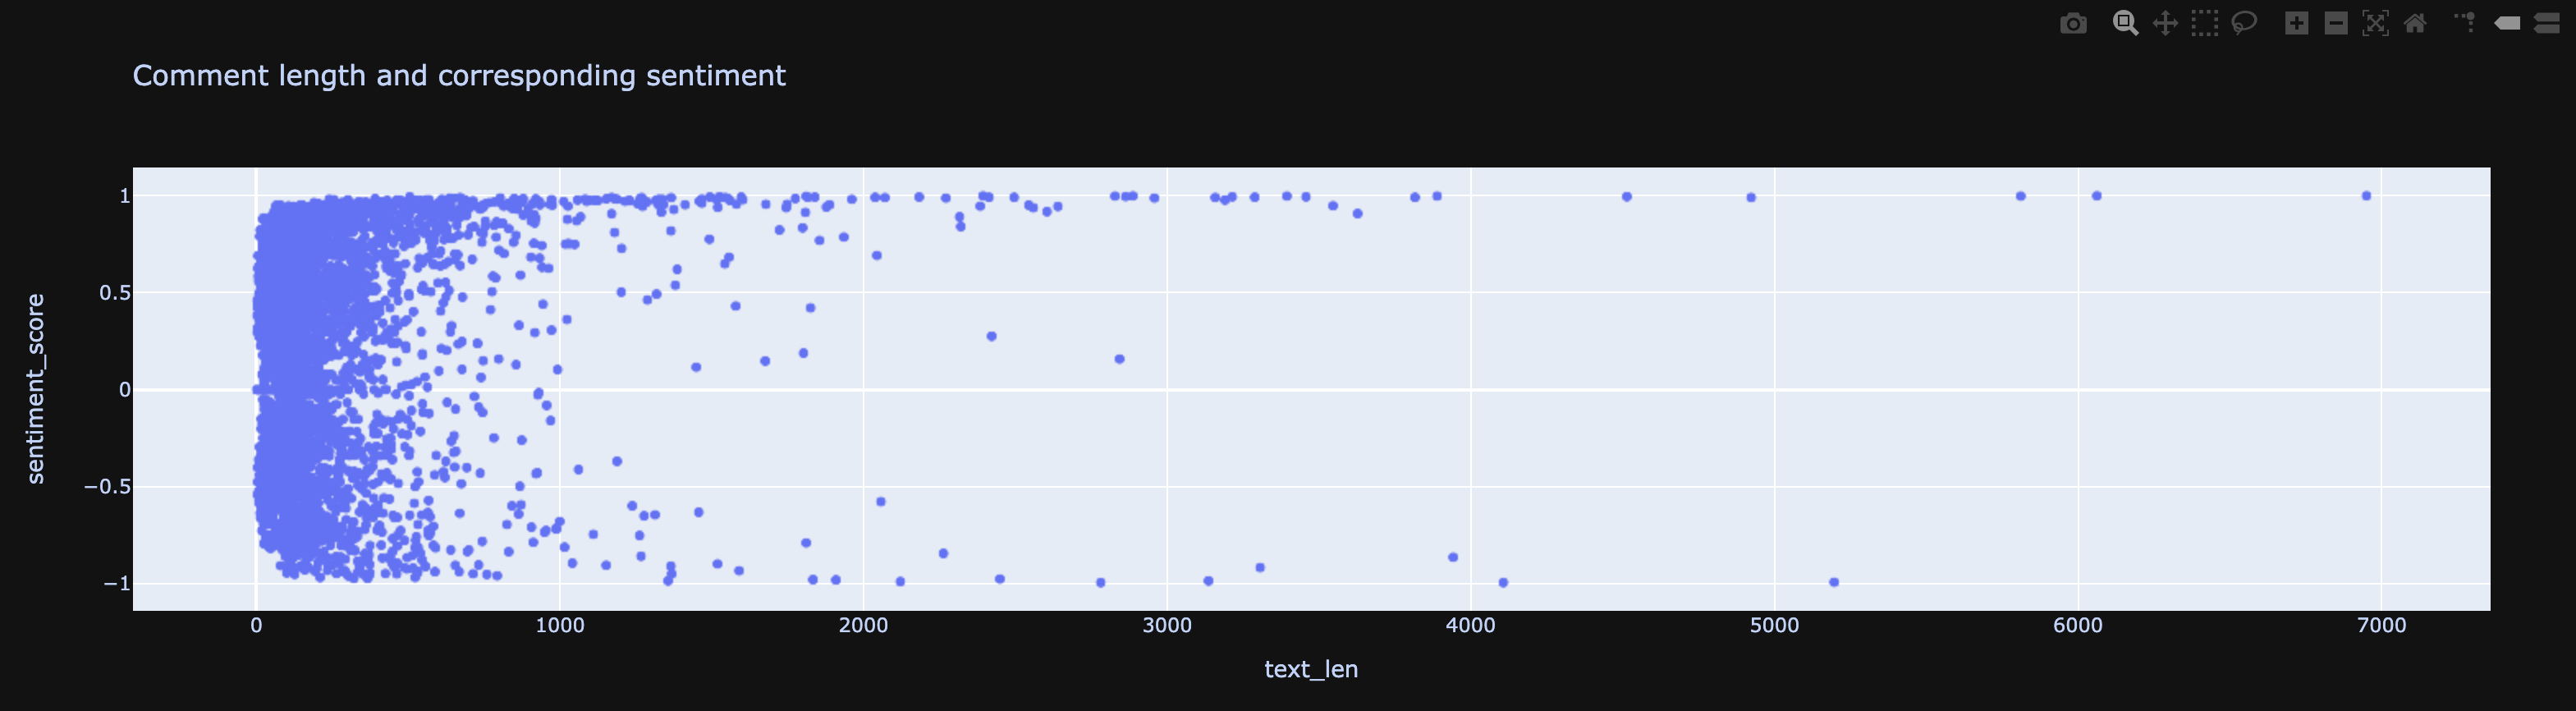
Comment Length vs Sentiment:
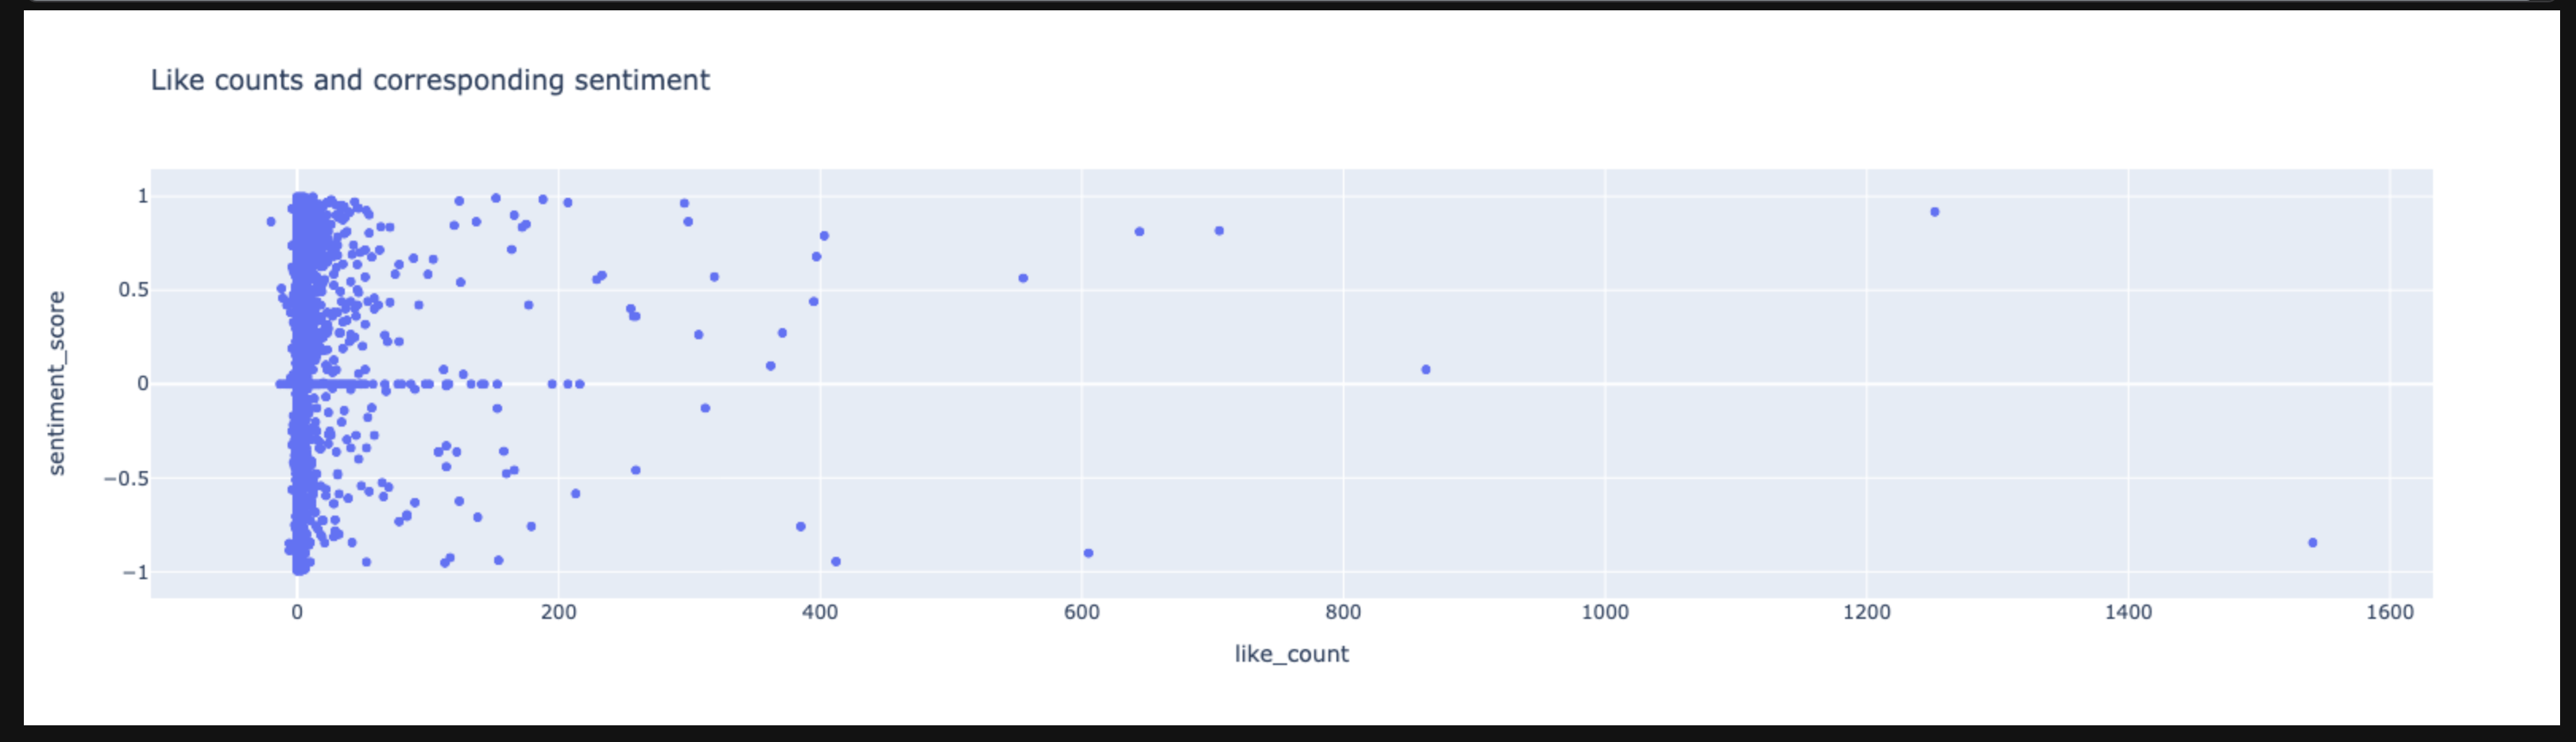
Like Count vs Sentiment:
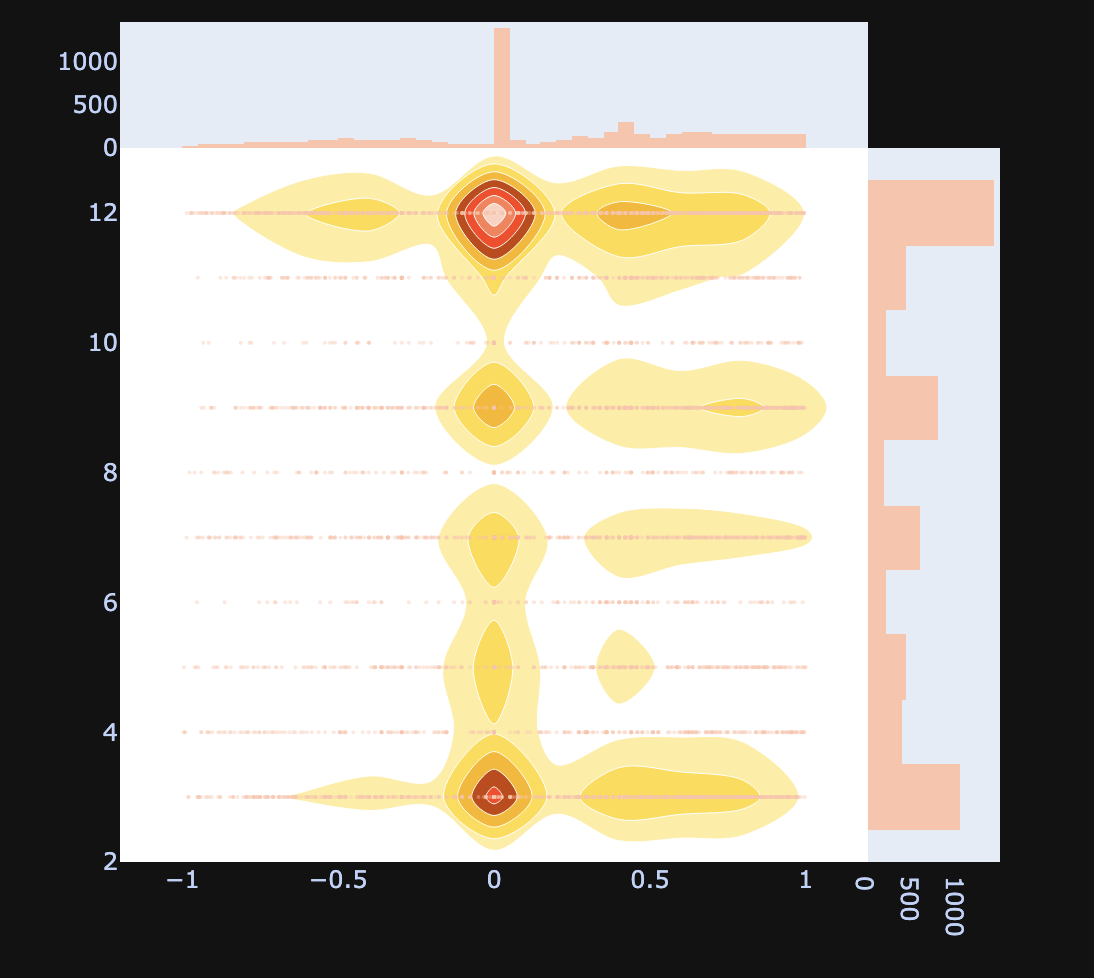
Bivariate Heatmap Comparing Comment Published Month and Comment Sentiment:
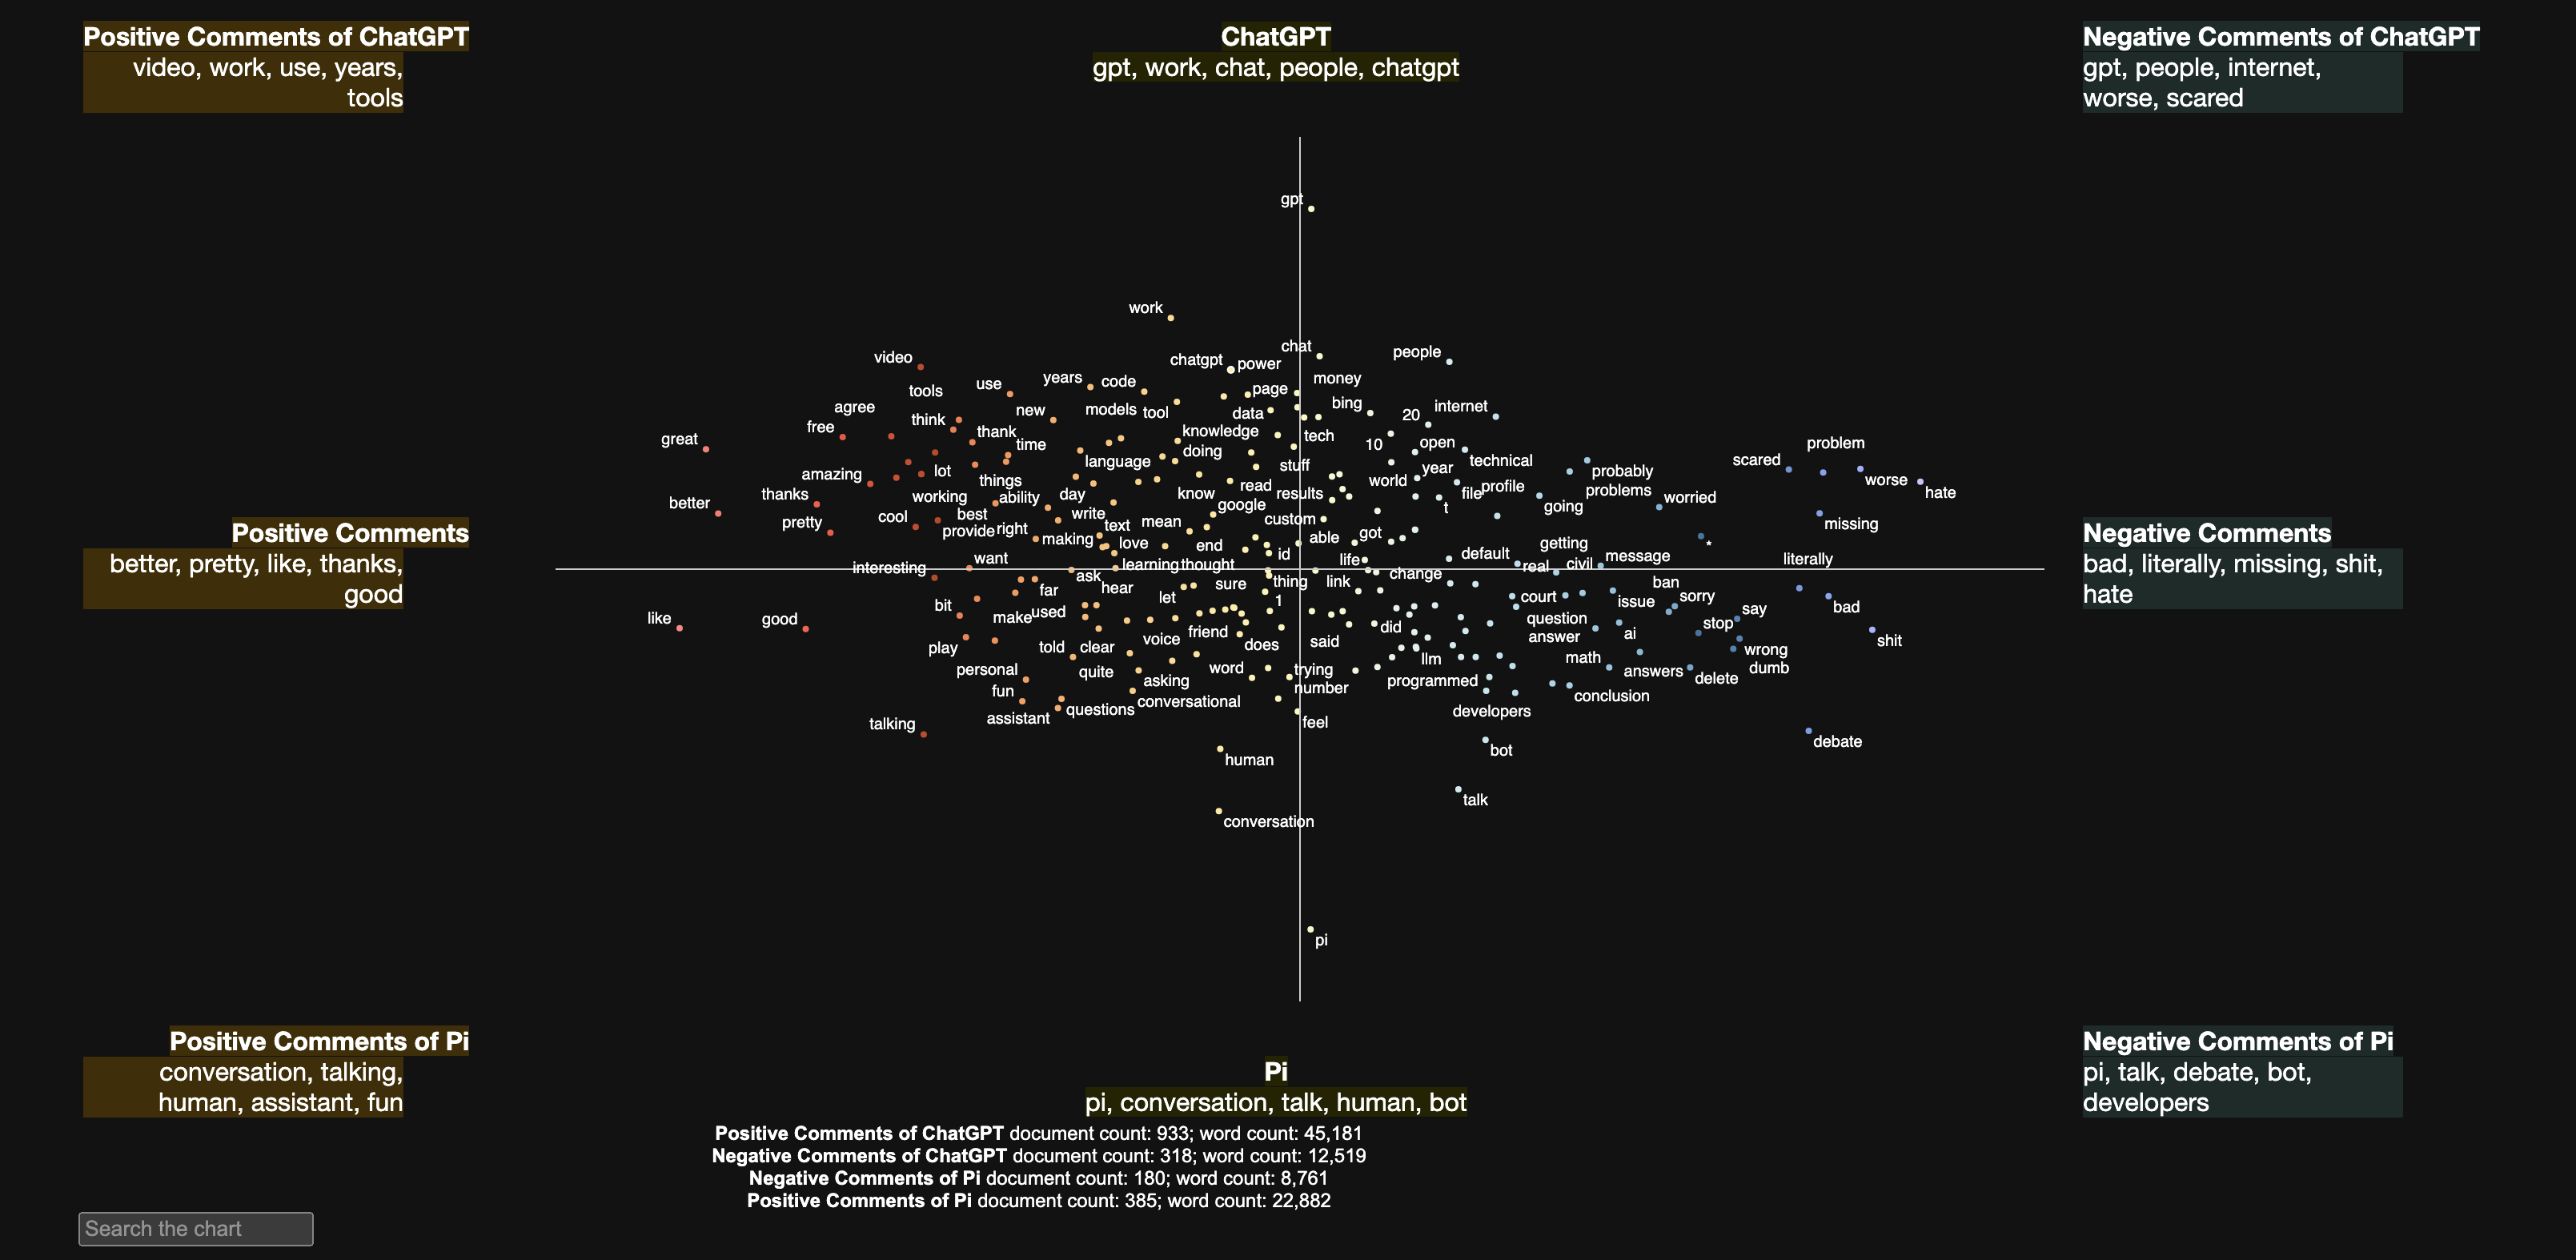
However, the visualization that answered the goal for this analysis was ScatterText. What follows explains why.
Discovering ScatterText was a game changer! It helped me achieve my original goal of graphing something interactive/more complex than what I have accomplished with Plotly libraries. Although using D3.js was the original plan, ScatterText helped me segregate words by sentiment - negative and positive in general (middle axis) and in opposing groups (top and bottom portions)! For this analysis, the opposing groups were ChatGPT and Pi. The sentiment segregation were not simply into positive and negative groups, but with the added y-axis for chatbot, able to see which unigram positive/negative words were associated with each chatbot.
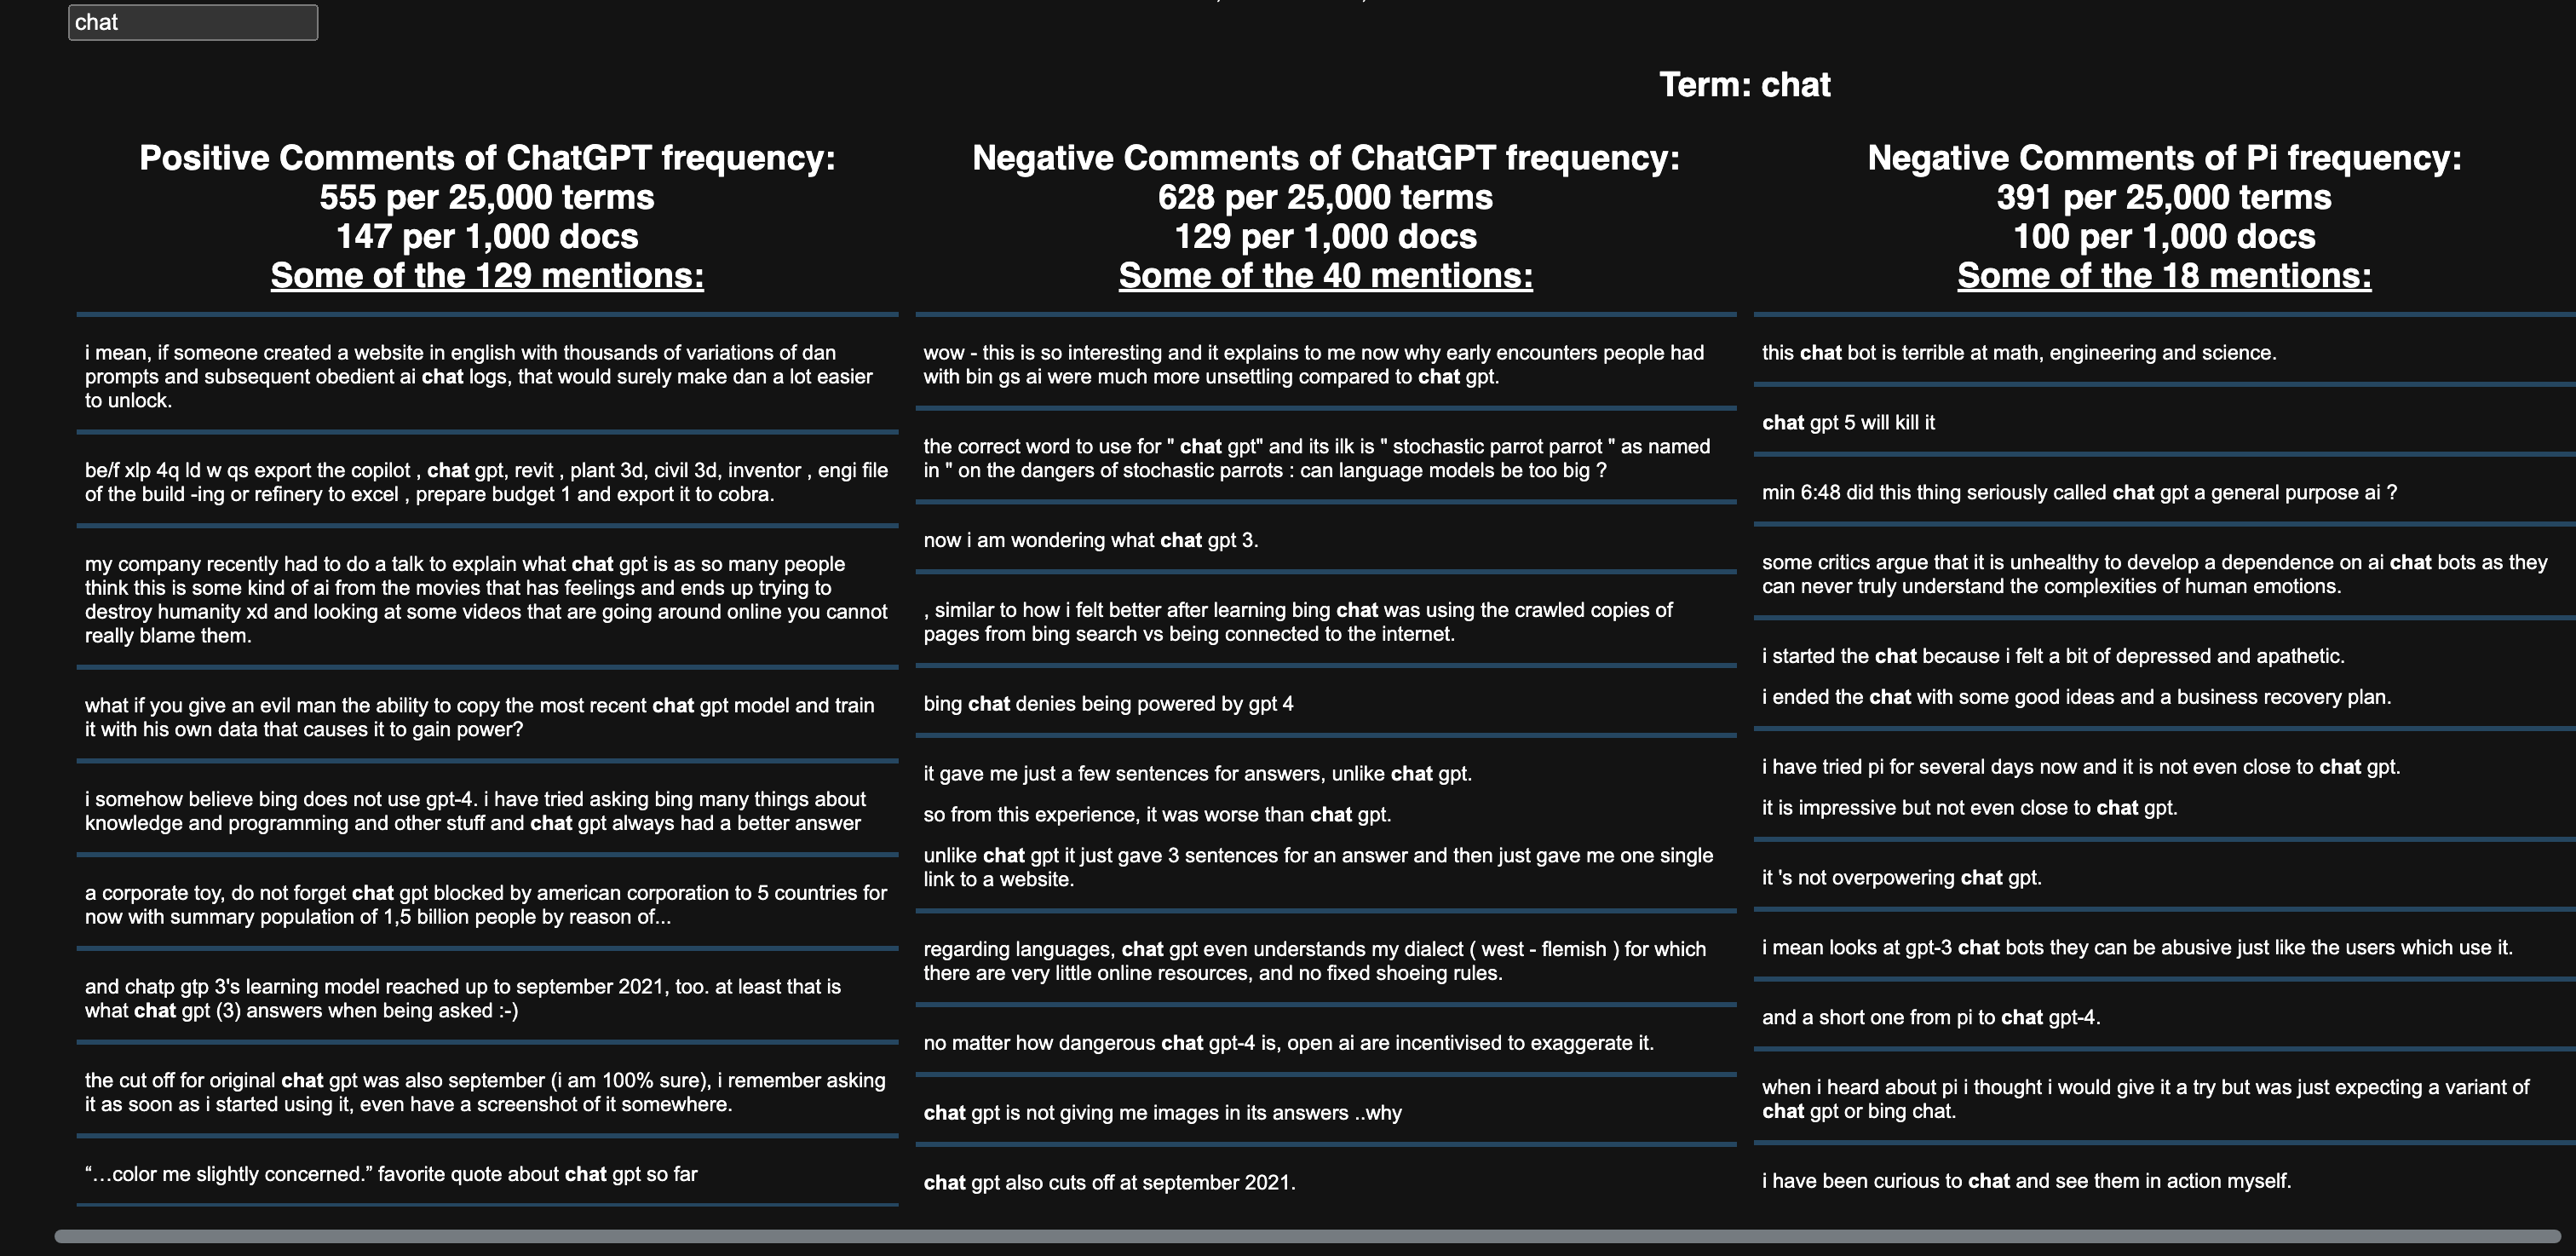
Last thing to note about the amazing ScatterText was the ability to use a search bar to find any term that appeared as a major unigram in a chatbot/sentiment. In the picture below, I searched for chat and all the comments that contained the word showed up. So cool!
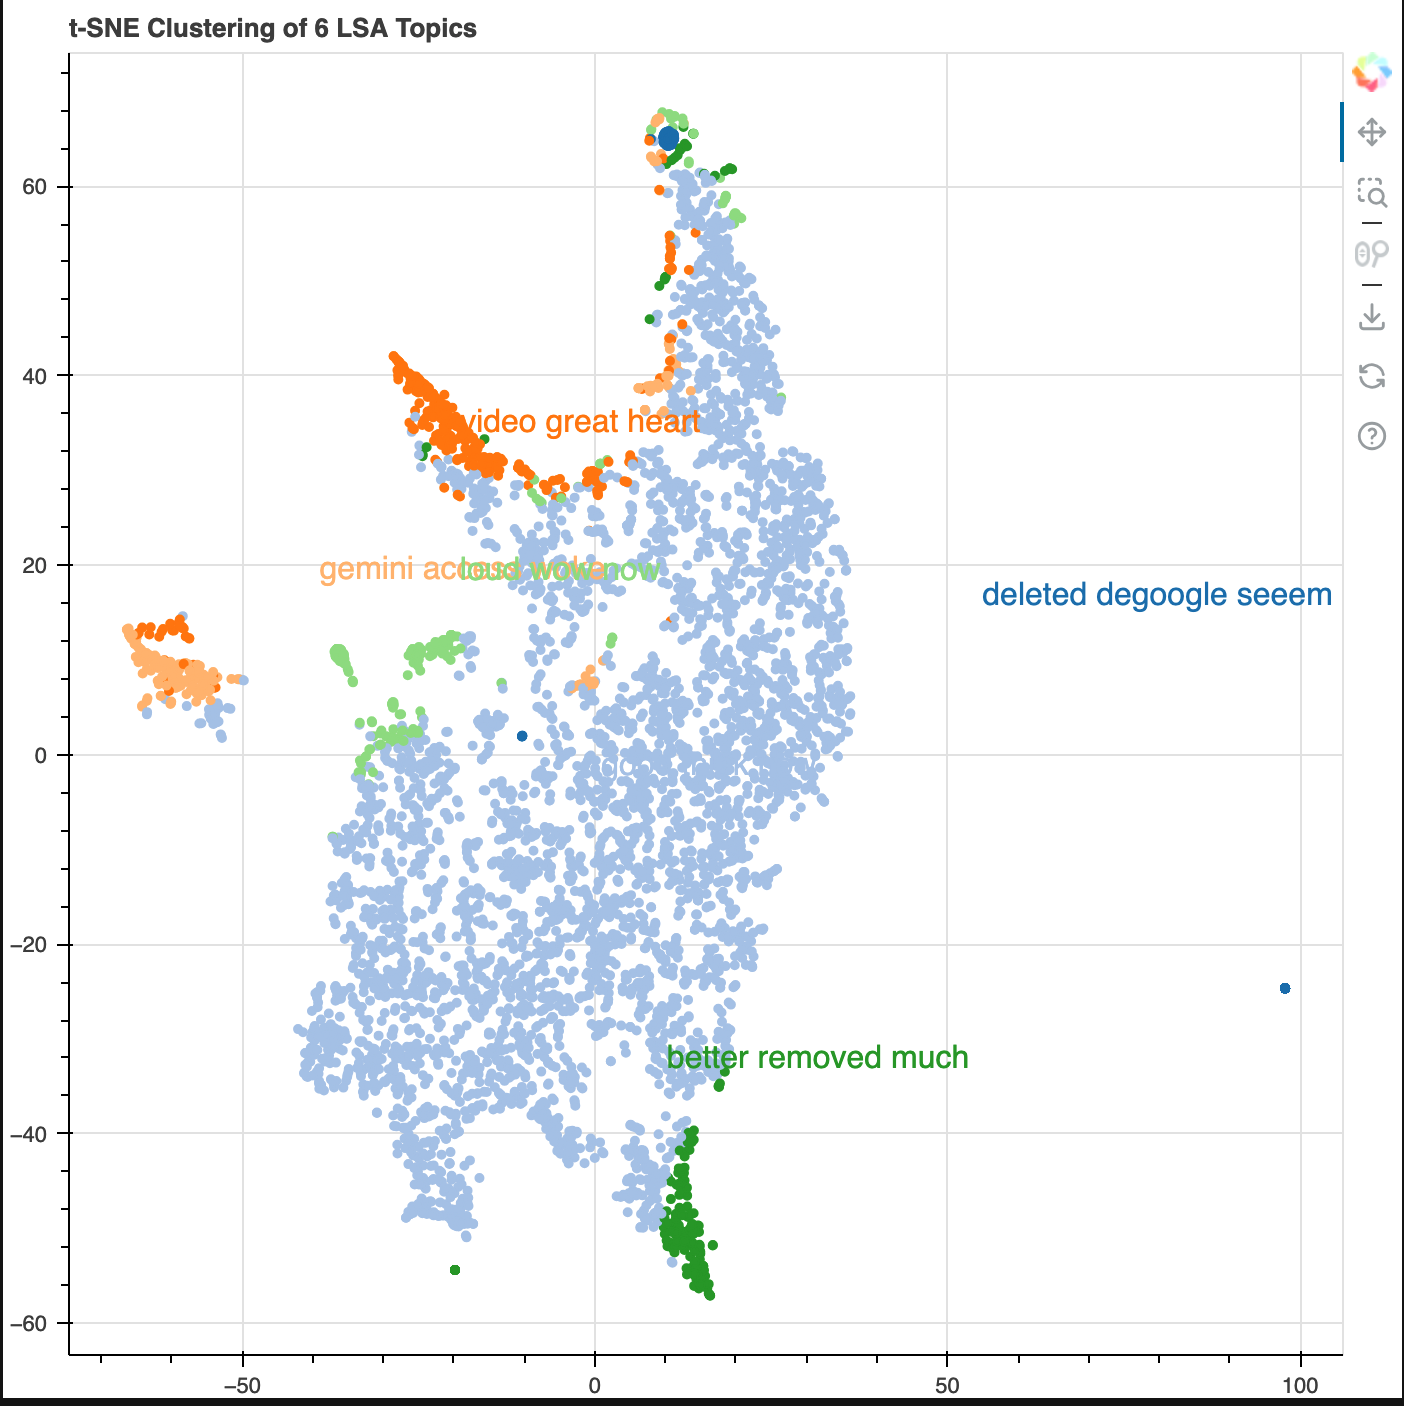
I also wanted to perform some topic modeling. I used Latent Semantic Analysis (LSA). The core idea is to take a matrix of documents and terms and try to decompose it into separate two matrices – A document-topic matrix. A topic-term matrix.
As you could probably tell, even with the small dataset, this created a high dimensional dataset. In order to reduce it for visualization purposes, t-SNE was used. Topics and their popularity were visible as well as its proximity/relationship to other topics. As mentioned before, unigram/trigrams were not providing enough user signal that spoke of chatbot features, so I thought looking at data at a higher level would be better. And this accomplished the job given needed to know the data for context to interpet the results (e.g. 'degoogle').
Next Iteration:
- More data from various platforms such as LinkedIn/Substack
- Extracting aspects from comments that describe chatbot features (aspect-based sentiment analysis)
- Add chatbot feature release dates to time series graphs to directly compare sentiment to new feature launches
- Bigrams/Trigrams/notable noun chunks for ScatterText
- Sentiment color for LSA clustering graph