Motivation
chatGPT and Claude have been the main chatbots in the market due to its ability to make formerly complex tasks much easier, one of them being writing code. In the earlier days of their release, they were known to help debug code, but now Claude helps construct full React app scripts given one prompt. This is a huge advancement considering how long it can take to just debug 1000 lines of code.
Problem Statement
I wanted to leverage Claude’s ability to write up full scripts by shortening the time of analysis. And not just complete basic explortatory analysis, but generate synthetic data as well as complete advanced descriptive and inferential analyses.
Usually, this type of work takes a couple of weeks, but it was shortened to less than a week and a half.
The value here is that stakeholders usually have last-minute/pressing questions. They need to respond to the market quickly, especially if they are an early-stage company. Here, I can whip up a prompt and with some human oversight/quality control for last-mile tweaks, a sophisticated dashboard on key performance metrics, exploratory analyses and predictive behaviors are instantly produced. This gives stakeholders quick insights to drive stategic decisions efficiently.
Technical Methodology
Data Generation and Preparation:
Synthetic data generation and valdation was enlightening considering AI expert, Ilya Sutskever, said age of pre-training will end due to the fact that data is not growing at the pace of LLM breakthrough’s. Also, last time I performed data validation was through dbt’s assertions.
During this step, I:
- Engineered synthetic customer data mimicking Sephora’s customer base, including customer demographics, product interactions, transactions and purchase history.
- Implemented data quality checks and preprocessing pipelines to ensure robust analyses
Descriptive Analytics:
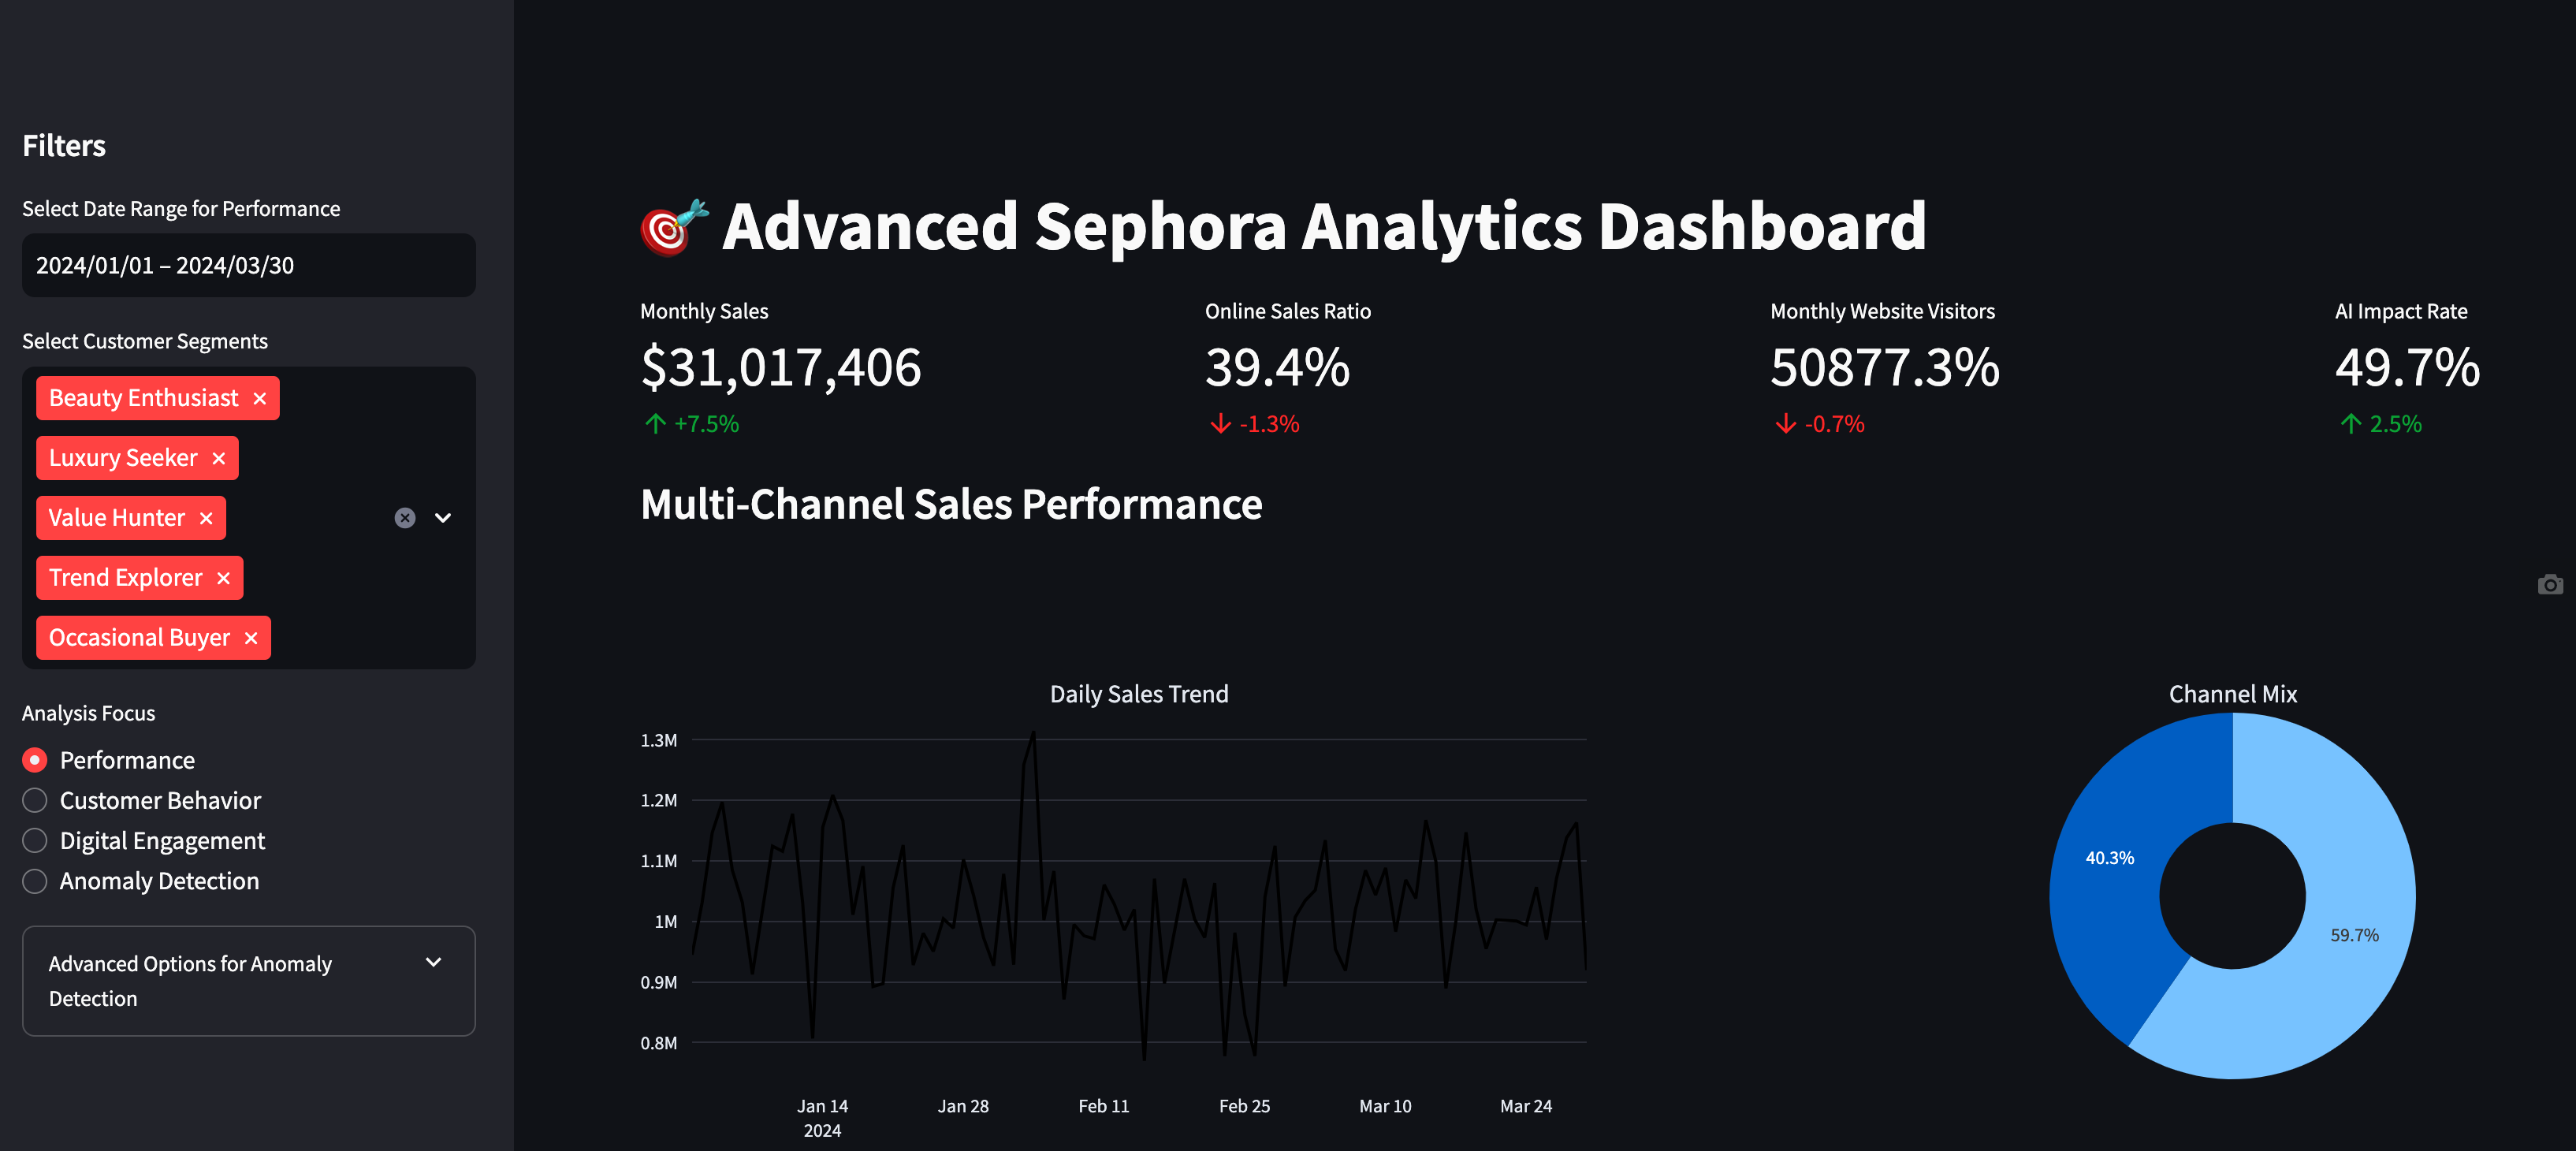
From a business perspective, it is essential to get updates on high-level business metrics to get a pulse on customer behavior/business performance. Usually, this is in the format of a dashboard. Coming from Python, the tool of choice was streamlit. The alternative was plotly’s Dash App, but I found it not as intuitive to build. And it was nice to use streamlit again for a different use case since last time I used it was for web-based model inference app.
Before generating the streamlit script, I reviewed the Visual Display of Quantitative Information by Tufte and The Big Book of Dashboards by Wexler, Shaffer and Cotgreave. The main take-away’s were:
- Establishing a clear visual hierarchy
- Using a consistent color palette (potentially incorporating Sephora’s brand colors)
- Implementing white space effectively
- Arranging metrics in a logical flow
- Using appropriate chart types for each metric (having some interactive)
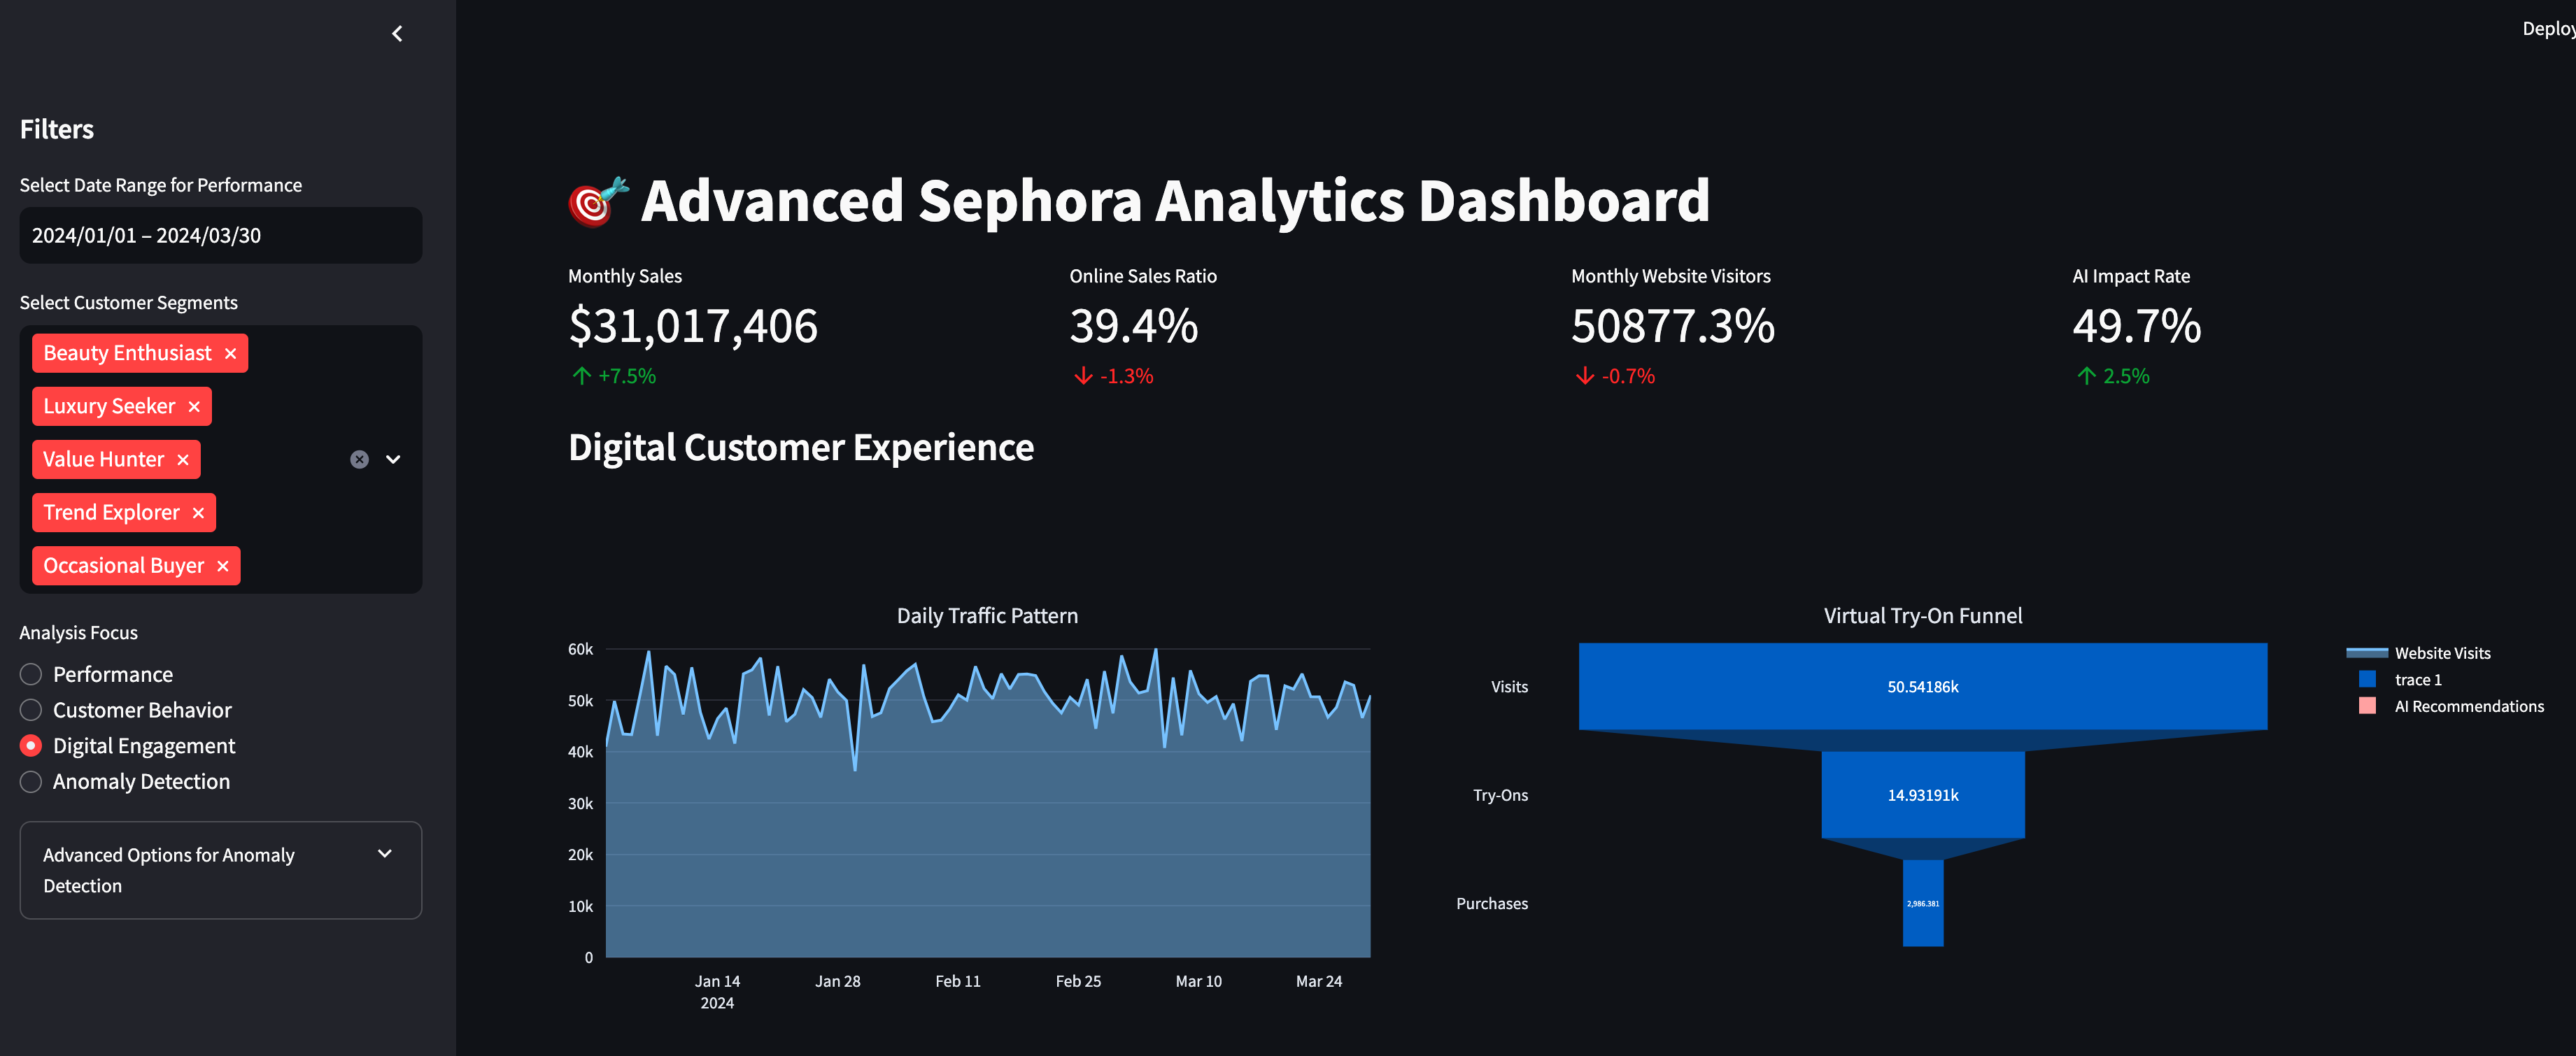
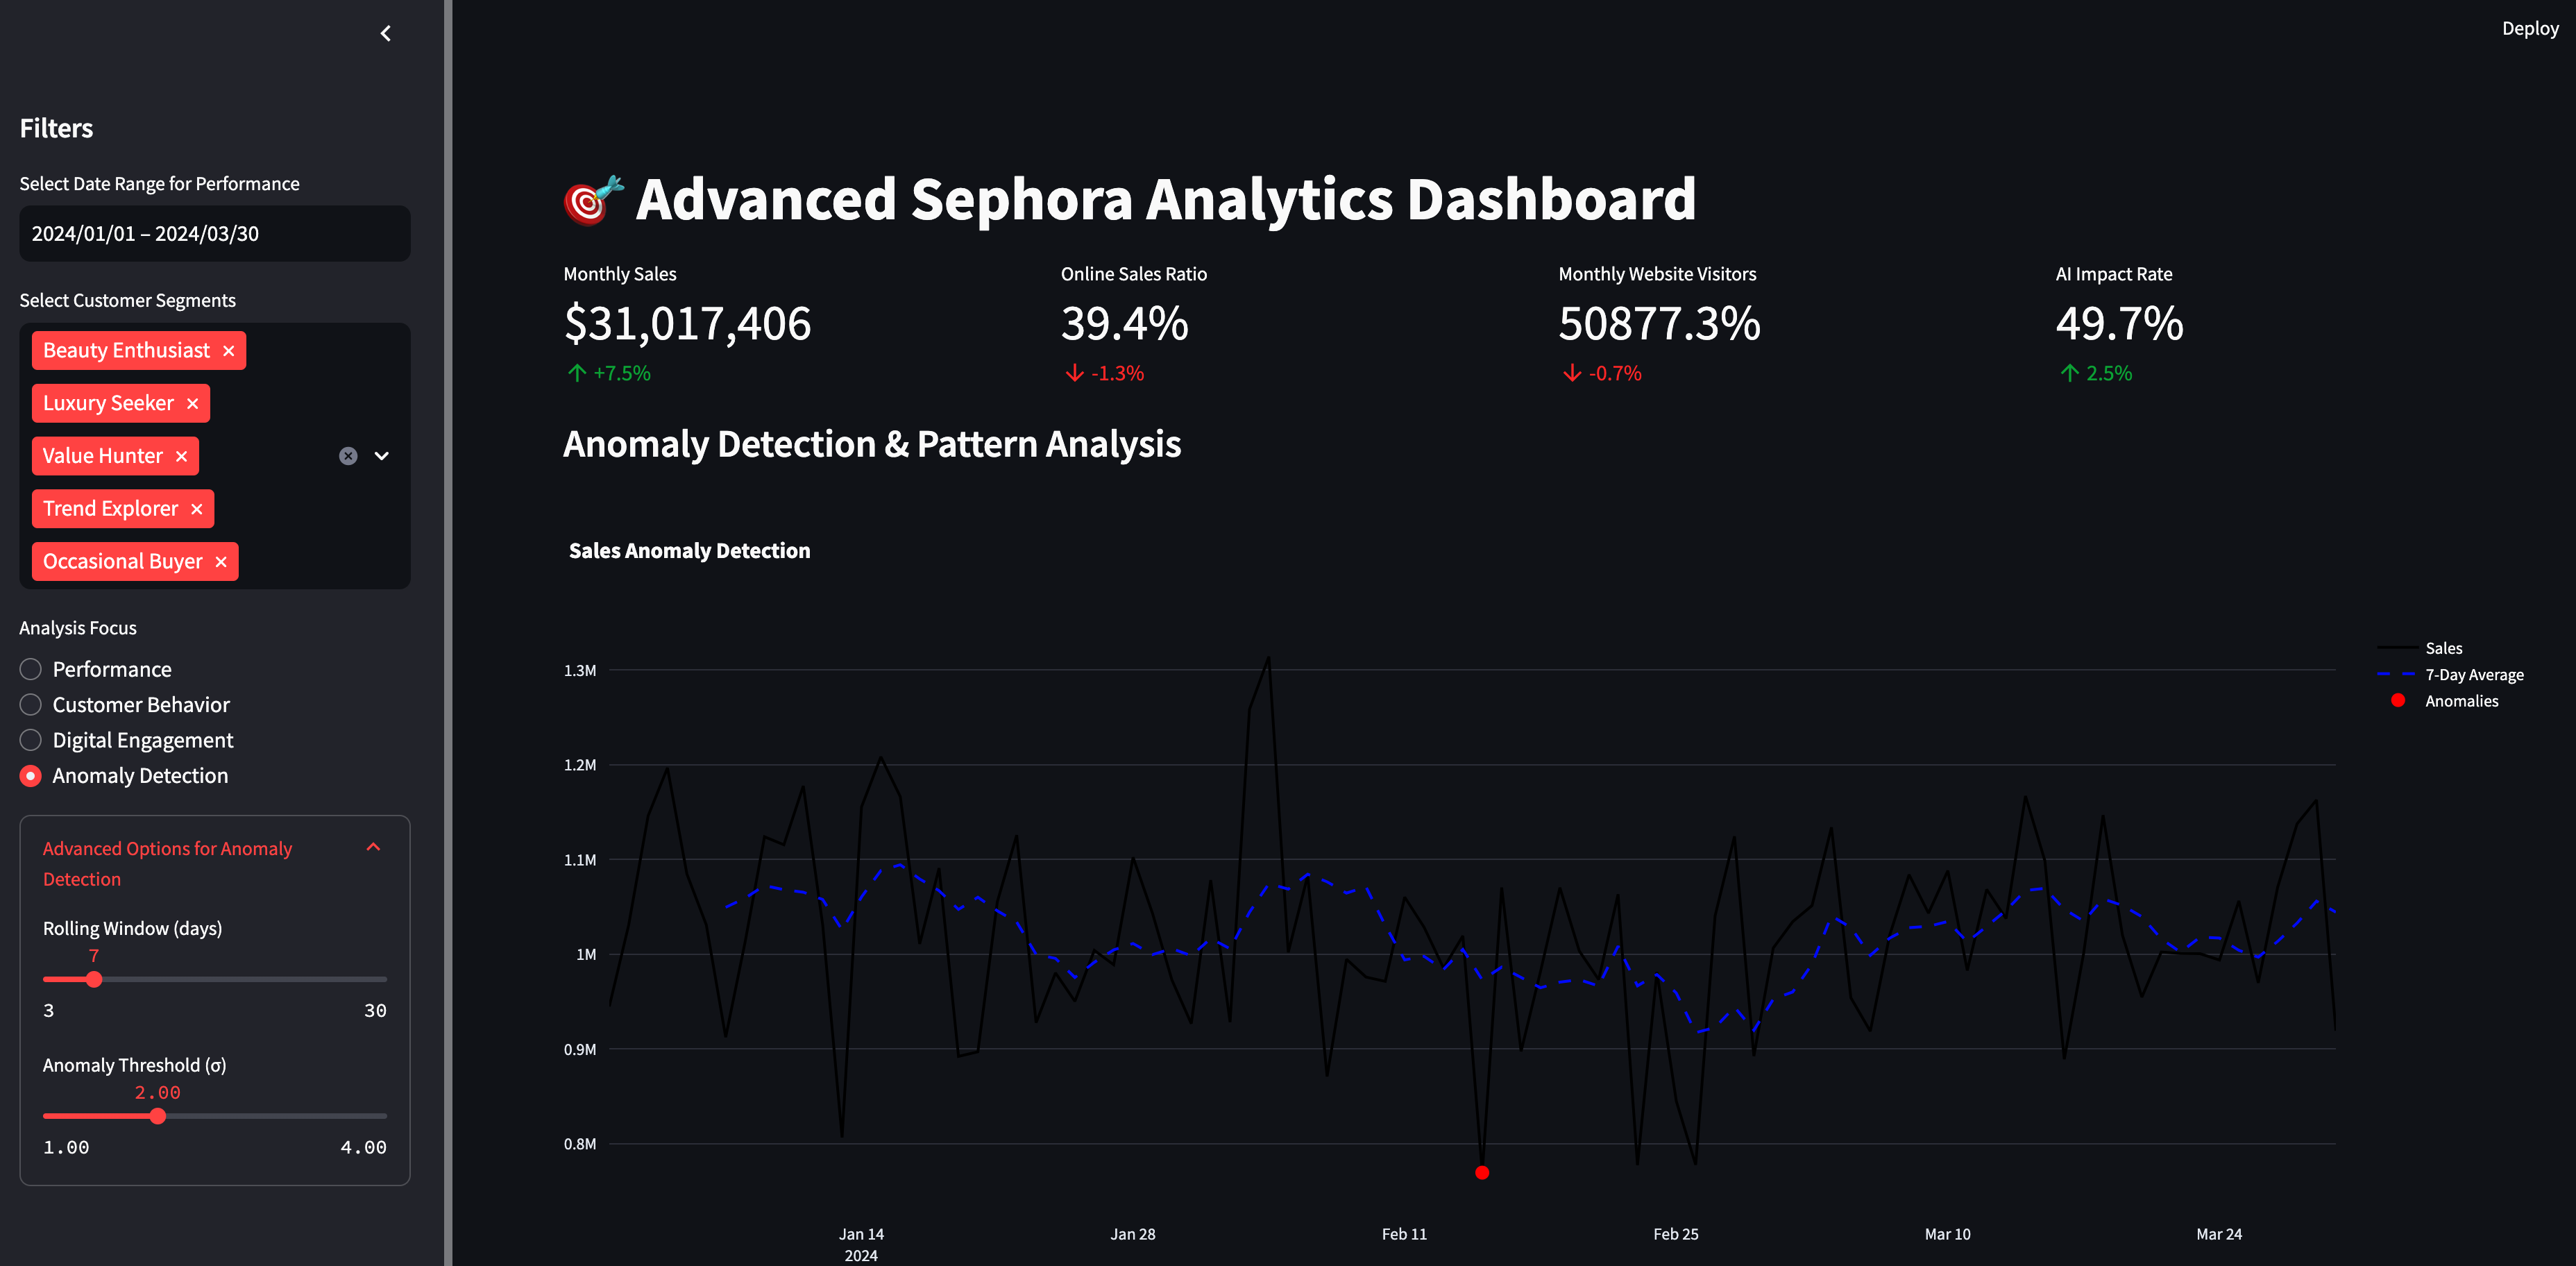
It was really cool going through the code and being able to not only have high-level metrics at the top such as total revenue, online sales and AI impact rate, but also different tabs to drill-down on the metrics. It was also fun being able to customize sidebar date and customer segment filters to make the dashboard more dynamic, interactive - user-friendly. This is what stakeholders like to do as they are trying to see the business at different angles and dimensions.
Exploratory/Predictive Analytics:
Linear and Logistic Regression
Ventured into Linear and Logistic Regression first in order to perform common inference tasks on customers- Lifetime Value (LTV) and their likelihood to churn. These are important metrics to put on customers to determine who to reward/nurture to maintain retention/prevent churn.
Created customer and transaction data and performed feature engineering, scaled data, fit model and predicted LTV and Churn. Final outputs were most important behaviors connected to each target variable. Purchase frequency was a strong indicator of LTV and average transaction value was a strong indicator of Churn.
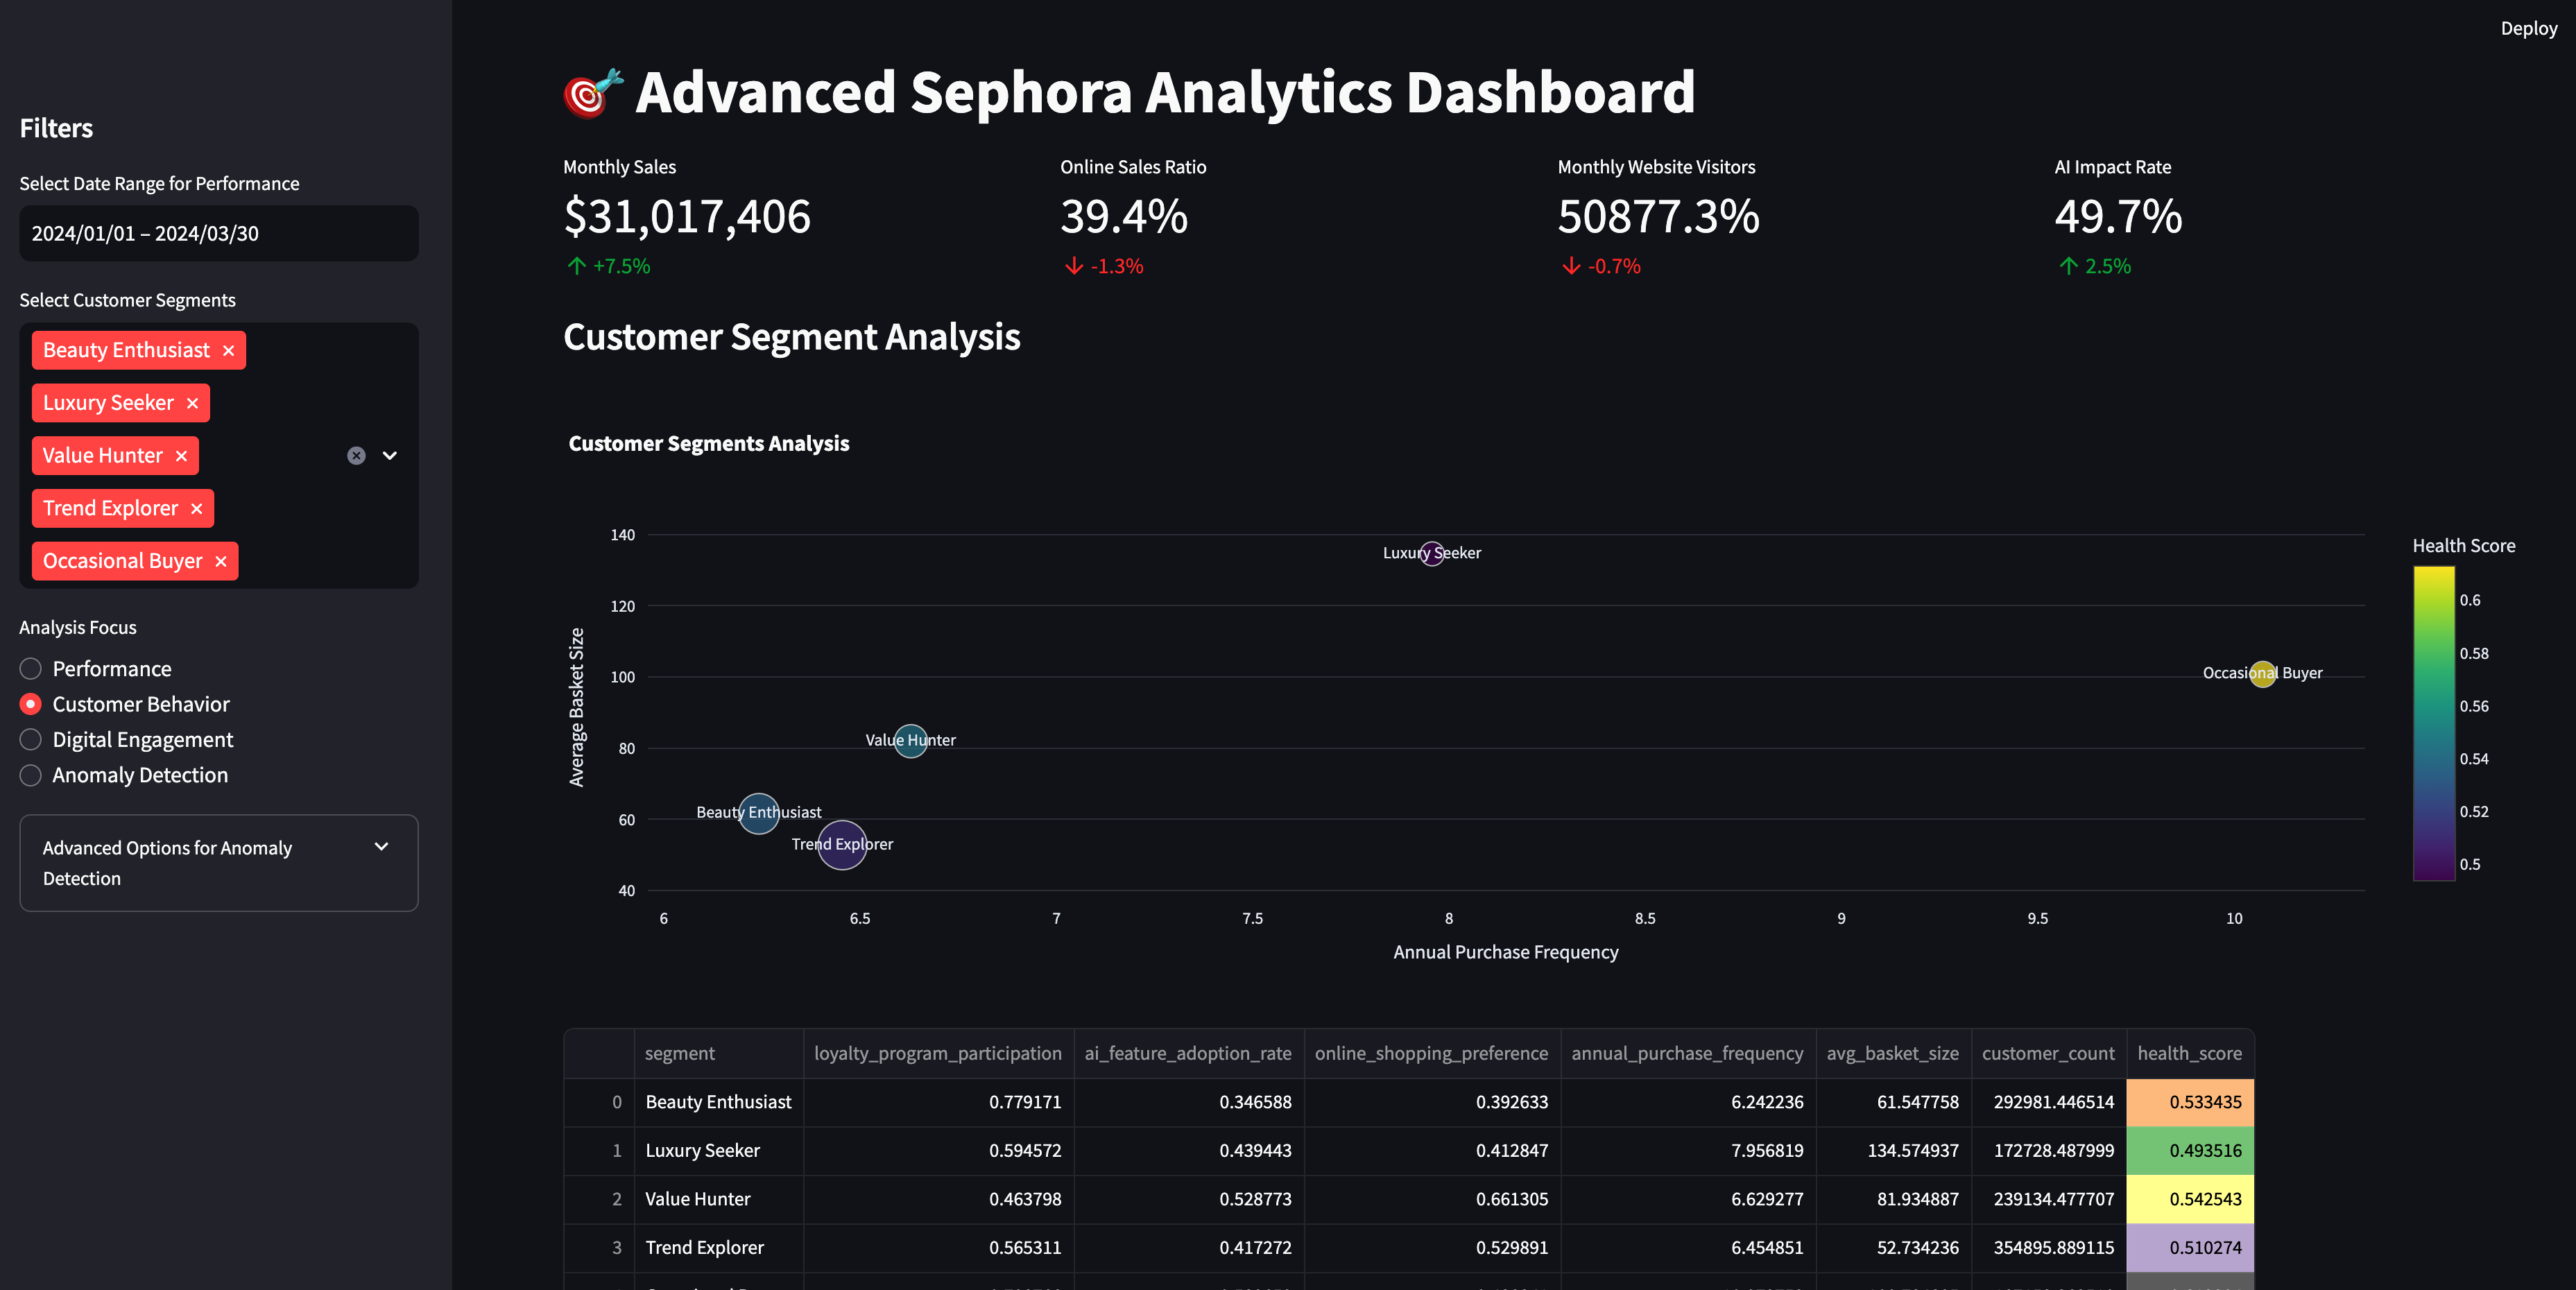
Using prior generated customer and transaction data, basic Recency, Frequency, Monetary (RFM) metric was put on customers to determine their overall value to the business. In order to perform more sophisticated customer segmentation, utilized Unsupervised Learning techniques.
Unsupervised Learning
Started with K-Means, then Hierarchical Clustering and finally PCA, which reduces the dimension space by grabbing the most important variables along with capturing the most variance in the original data.
Some visualizations were helpful such as Radar graph that showed how different segments differed based on chosen behavior/features of interest.
At the end of this user insights analysis, a comprehensive business report was generated that detailed next-steps/recomendations at customer and product levels.
Deep Learning
These algorithms allow for large and complex data (images, audio, video) input, automatic feature engineering, have state-of-the-art performance and can be used across various domains from health to e-commerce. Several retail use cases follow that utilized deep learning algorithms.
Neural Collaborative Filtering (NCF)
- Uses user-item interaction data (e.g., clicks, ratings) to predict missing preferences.
- Traditional methods (e.g., matrix factorization) decompose the interaction matrix into latent factors for users and items.
Deep Learning Extension:
- NCF replaces linear models (e.g., dot products) with neural networks to learn complex, non-linear interactions between users and items.
- The model takes user and item embeddings as inputs, processes them through fully connected layers, and outputs a predicted interaction score.
This is used for product recommendations. Visualization such as Distribution of Recommendation Scores allows us to see if the model is biased or poorly trained/insufficiently learned, which is seen in this run’s uniform distribution.
LSTM
- LSTMs are a type of recurrent neural network (RNN) designed to model sequential data while addressing the limitations of traditional RNNs (e.g., vanishing gradients).
Sequential Modeling:
- LSTMs are designed for data with temporal dependencies, where the order of observations matters.
- They maintain a memory cell that learns what to retain, forget, and output at each step via gates (input, forget, and output gates).
Advantages over RNNs: The gating mechanism allows LSTMs to capture long-term dependencies, which RNNs struggle with.
This was used to predict Churn whose performance is seen in ROC Curve, Precision-Recall Curve as well as Confusion Matrix. This was an alternative to the Random Forest Classifier seen earlier. There still needs to be some modifications to the model as the visualizations show opportunity for performance improvement.
LLM’s and Multimodal Models
It was nice to see LLM’s used for different purposes other than the usual tasks: sentiment classification or creating summaries. Specifying Sephora for context allowed me to see different use cases of LLM’s across different business org’s, such as Marketing, Inventory and AI.
Most of the technical bottlenecks were due to pre-trained models, undefined parameters, fine-tuning parameters and undefined helper functions.
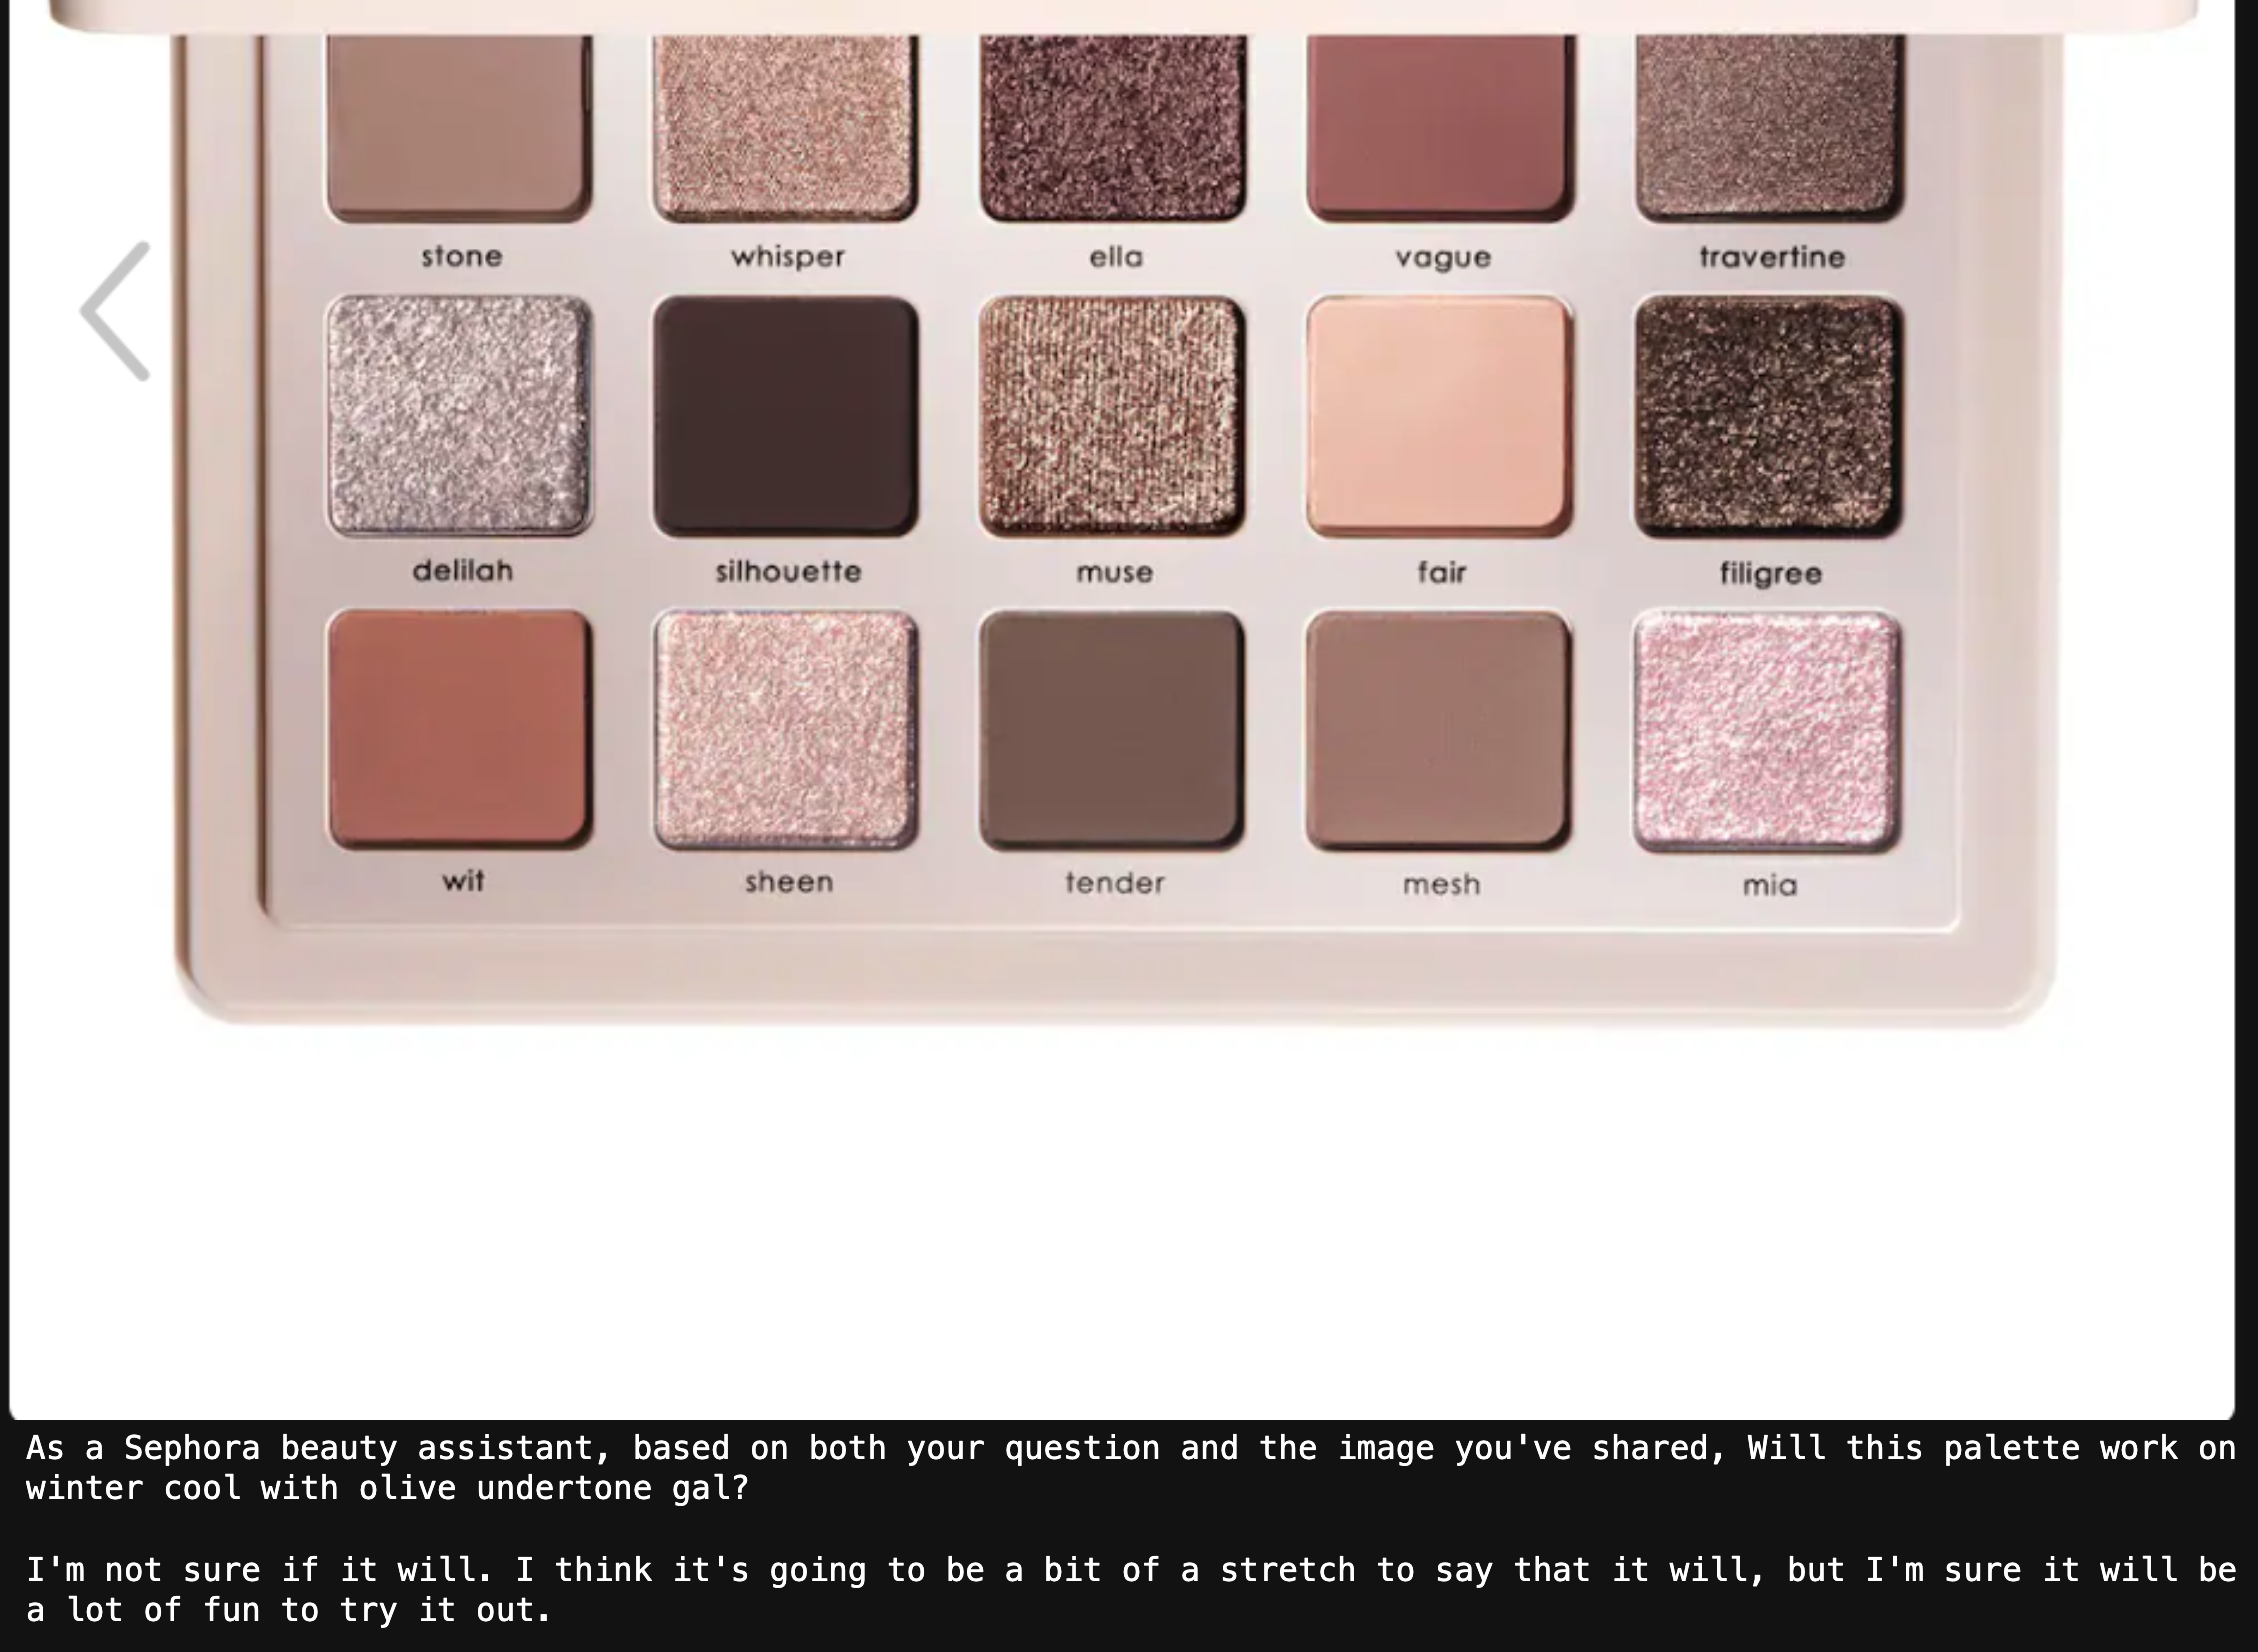
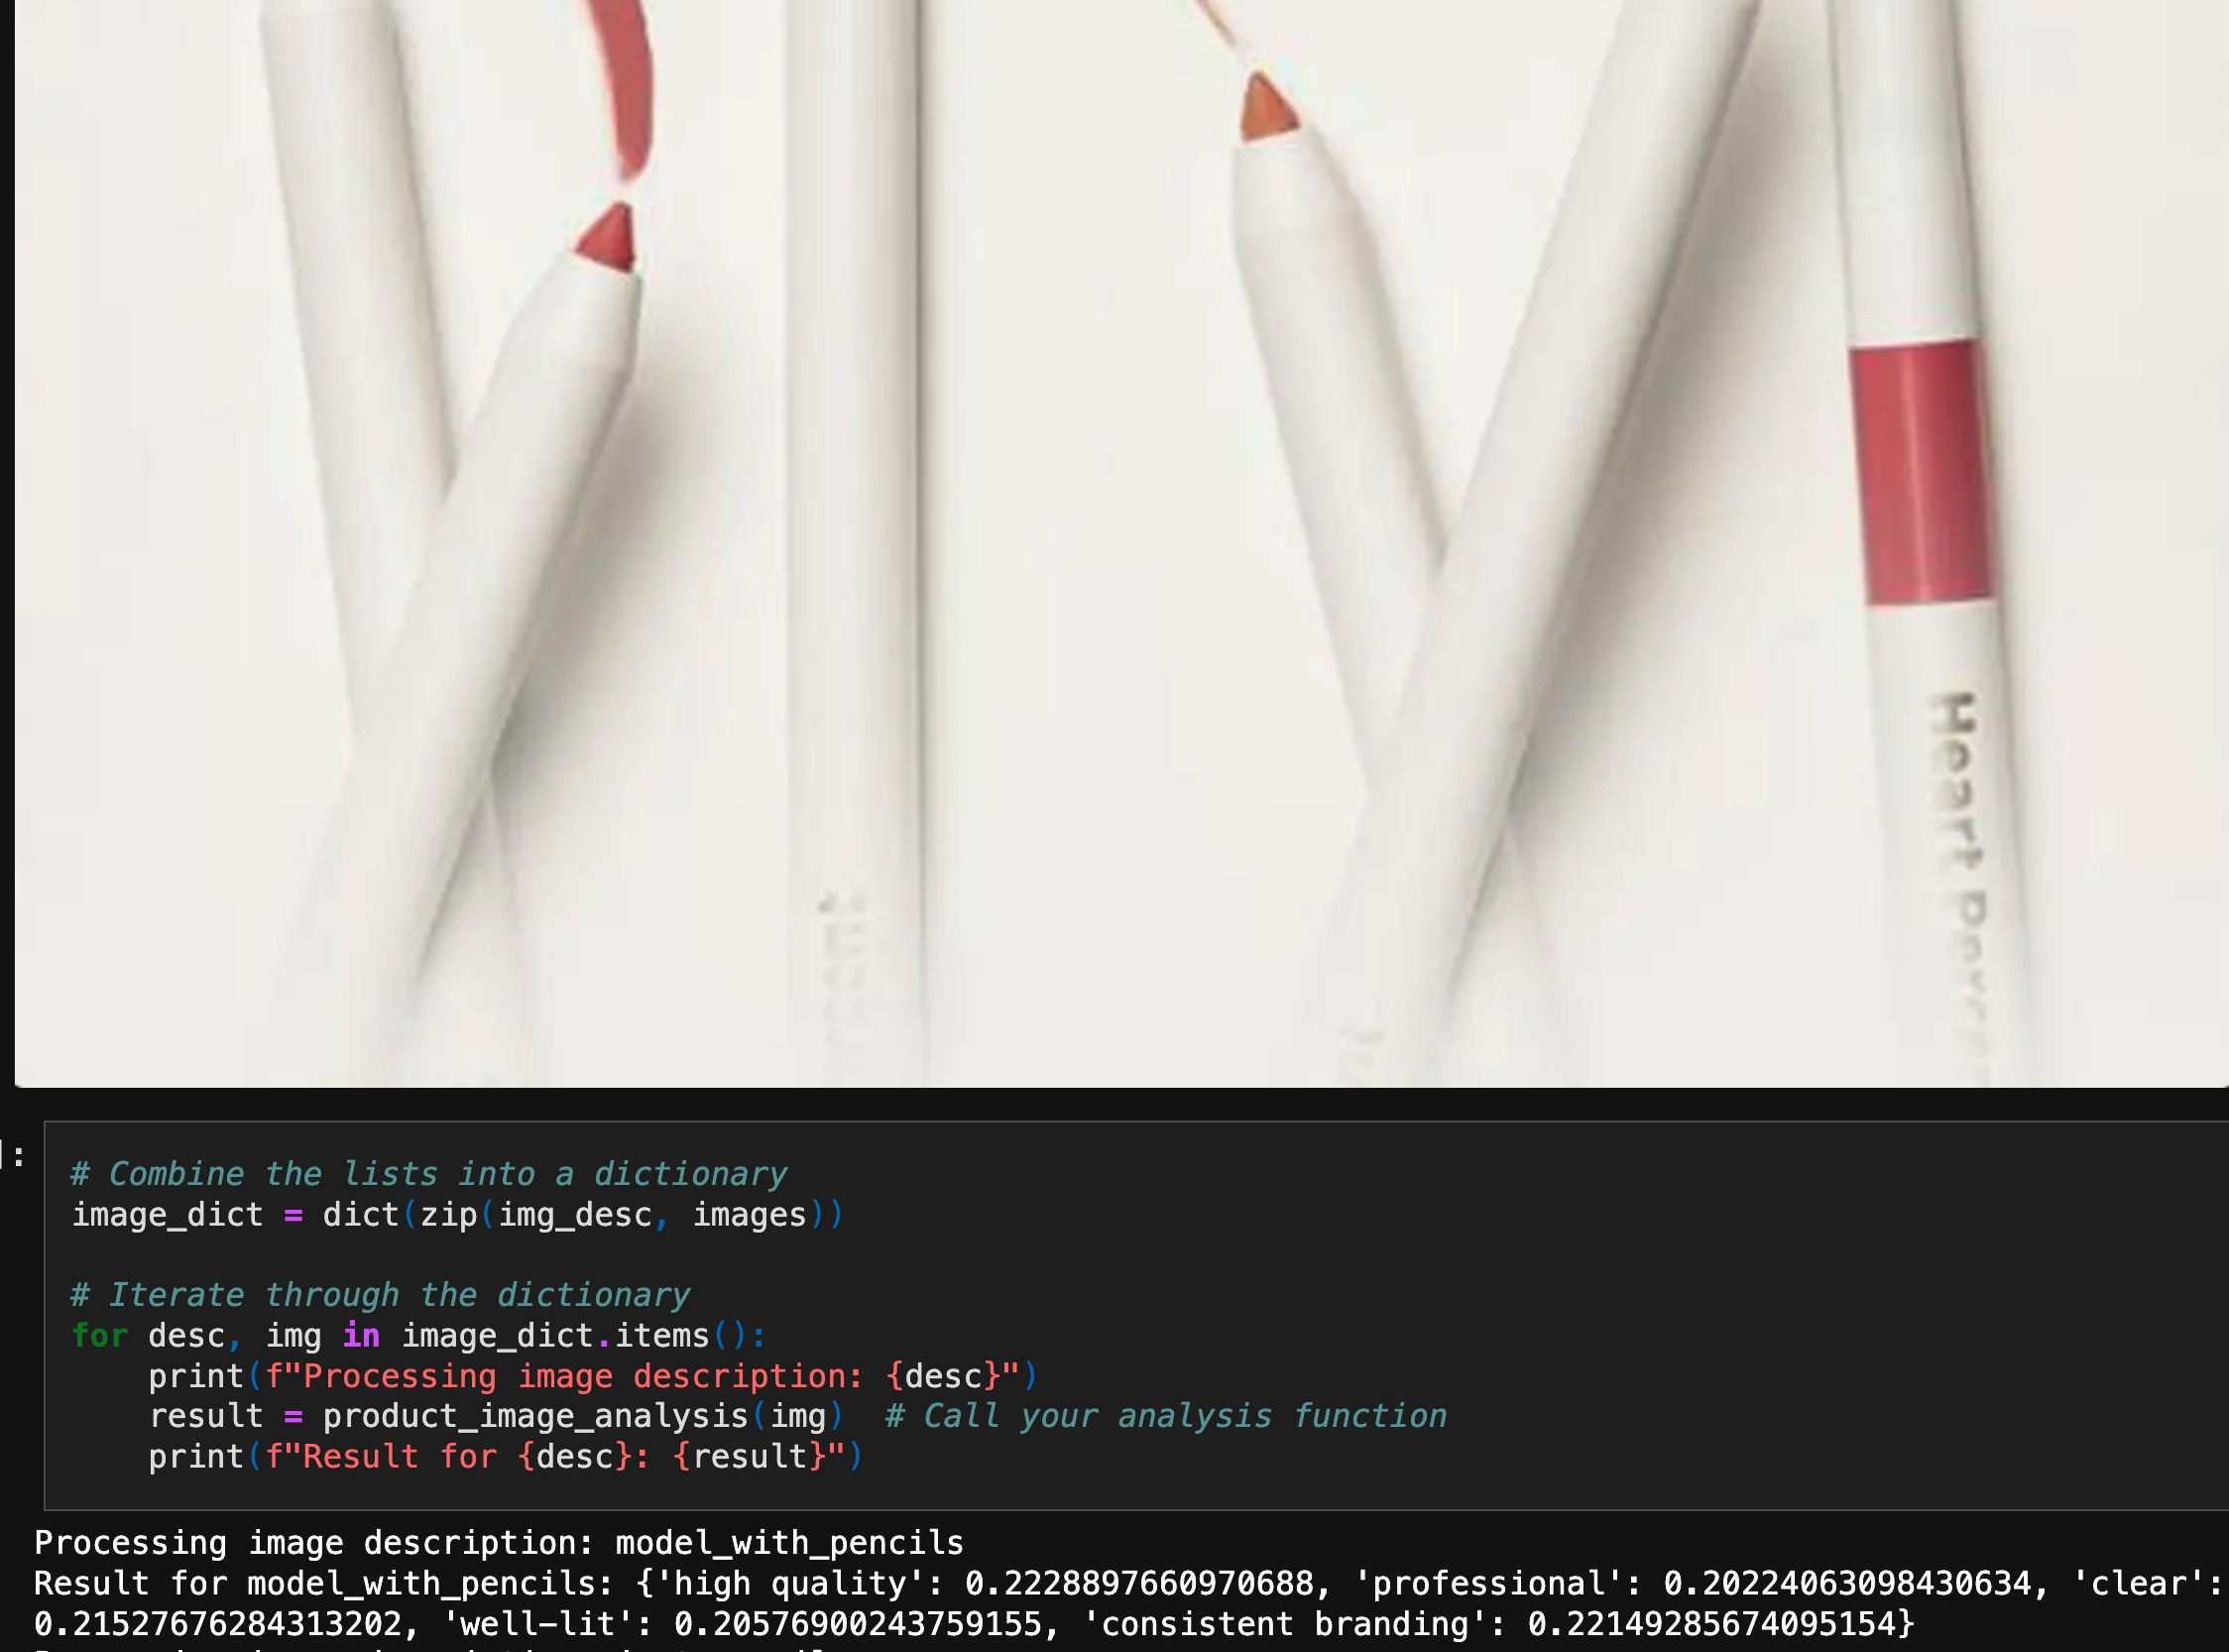
Most interesting models to work with were those that took in text and images because I was able to see the interaction between two different input’s. For example, one model was able to determine brand consistency given images and list of criteria used to assess if a picture meets the bar for a product marketing launch. Second example of mixed input’s was given an image of an eyeshadow palette and a question about it, a Virtual Beauty Assistant would give their opinion. That was very interesting given my prior experiences were opinions from Sephora beauty experts and various Reddit comments.
I noticed that many LLM models had some crude/almost-there output’s because the models needed be trained on beauty/Sephora data and/or model needed to be fine-tuned more.
Impact
Given that this year will be the year of agents and that we are getting closer to AGI, it was advantageous to brush up on the foundational models that preceed them. The forecast is that repetitive tasks such as those that some Analysts do will be taken over by agents. So it was beneficial to see how much time I saved and oversight I needed when a chatbot helped complete common Analytics/Data Scientist tasks.
Lessons/Growth
- Get more complex data at bigger scale
- Fine-tune/train models
Next Steps
- data generation as was done with some open-sourced LLM research papers
- given synthetic data, dashboarding Sephora metrics in Tableau
- spinning up these tasks using smolagents (huggingface)